Overview
Global radio spectrum allocation is coordinated by the International Telecommunication Union (ITU). The ITU is a United Nations specialized agency responsible for international public telecommunications affairs. Countries typically follow ITU recommendations for spectrum allocation, although specific national allocations may differ.
Spectrum allocation process
The spectrum allocation process is broadly as follows:
- The ITU convenes the World Radiocommunication Conference (WRC) roughly every 3–4 years to review and revise global spectrum use.
- Each country or region has its own spectrum management authority, such as the U.S. Federal Communications Commission (FCC) and the European Communications Office (CEPT). These authorities make specific national allocations based on ITU recommendations and local needs.
- Allocation results are published in spectrum allocation charts that indicate frequency ranges and assigned services for each band.
- Allocations are updated over time to accommodate new technologies and changing demand, for example the rollout of 5G networks.
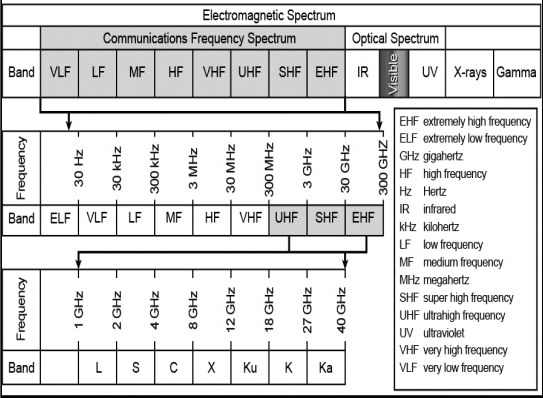
In practice, the radio spectrum is divided into many bands, each assigned to particular services such as mobile communications, broadcasting, and satellite navigation. Allocations may vary by country and region but generally follow ITU guidance.
Reading an X-band allocation chart
The following example shows how to read an allocation chart for the X band.
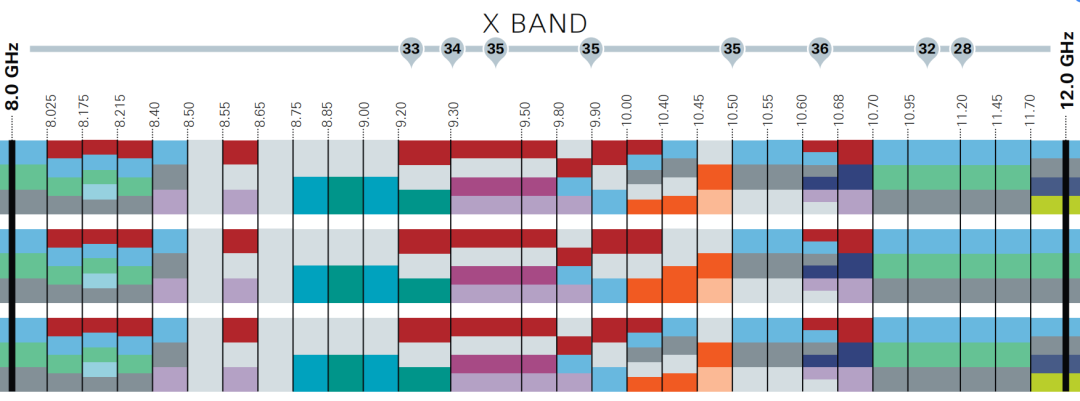
The X band covers 8.0–12.0 GHz. The chart is divided by white lines into three regions, from top to bottom: REGION 1, REGION 2, and REGION 3.
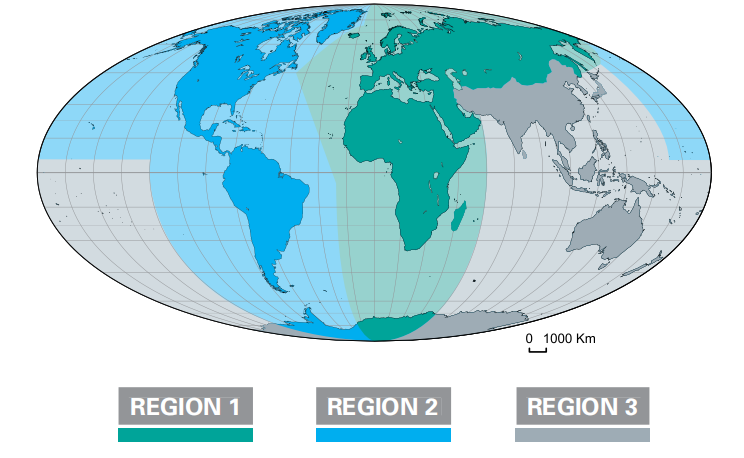
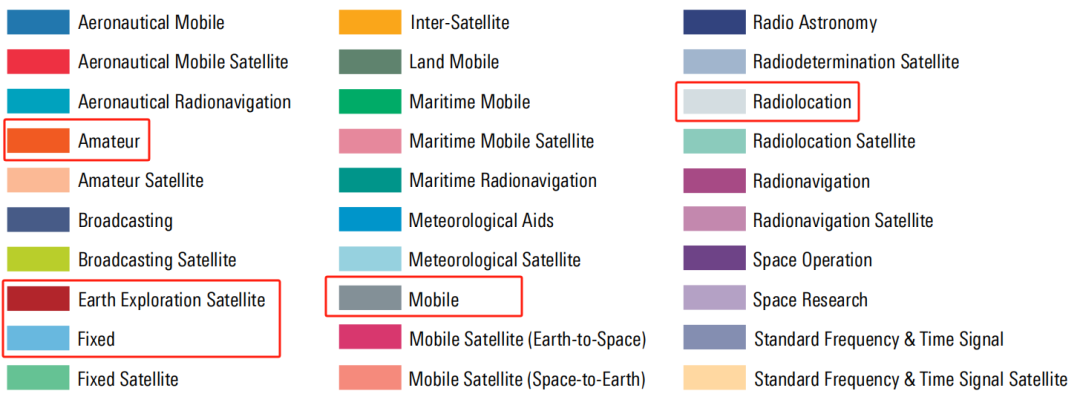
Within a frequency range, colors indicate the intended use of that band.

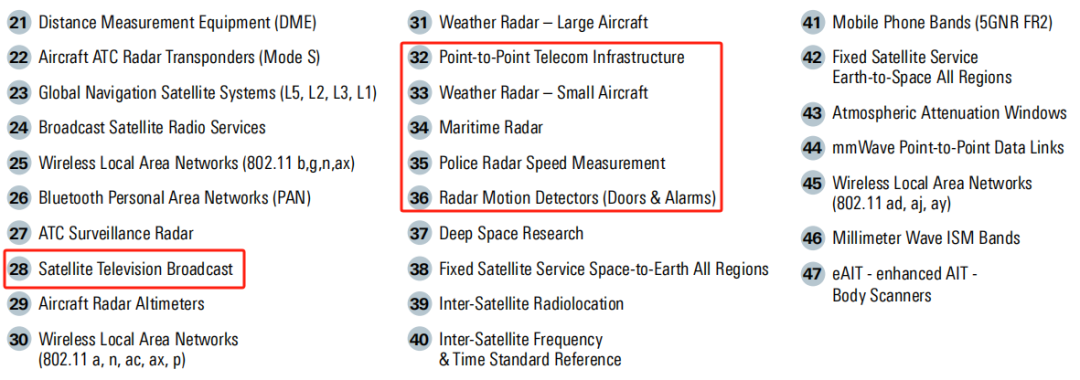
The chart segment for 10.0–10.4 GHz corresponds to the uses listed in the table below.
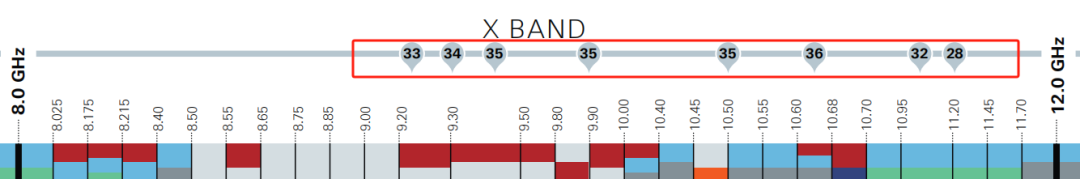
The numerical labels on the chart can also be used to check the application ranges for specific frequency points of interest.