Problem background
With the rise of microservices architecture, services are split along multiple dimensions and a single request often touches many services. Internet applications are built from different software modules that may be developed by different teams, implemented in different programming languages, and deployed across thousands of servers spanning multiple data centers. Tools are needed to understand system behavior and analyze performance issues so faults can be located and resolved quickly.
Full-stack tracing emerged to address these needs. The most cited work is Google's paper on Dapper. To understand the behavior of distributed systems in this context, it is necessary to monitor interactions that span different applications and servers.
In a complex microservices architecture, almost every frontend request generates a complex distributed call chain. A complete request call chain may look like the following:
As business scales, services multiply, and changes are frequent, complex call chains create several problems:
- How to detect issues quickly?
- How to determine the fault impact range?
- How to model service dependencies and validate their reasonableness?
- How to analyze chain performance and perform real-time capacity planning?
During request processing we focus on metrics for each call, for example throughput (TPS), response time, and error logs.
- Throughput: compute real-time throughput for components, platforms, and physical devices based on topology.
- Response time: includes end-to-end response time and per-service response times.
- Error logs: count exceptions per unit time based on service responses.
Full-stack performance monitoring presents metrics from global to local, centralizing cross-application call chain performance information. This facilitates measuring global and local performance and locating the root cause of failures, significantly reducing mean time to resolution in production.
With full-stack tracing tools we can achieve:
- Request trace and rapid fault localization: use call chains and business logs to quickly locate errors.
- Visualization: analyze time spent at each stage.
- Dependency optimization: assess availability of call segments, map service dependencies, and optimize accordingly.
- Data analysis to optimize chains: derive user behavior paths and aggregate analysis for many business scenarios.
Goals and requirements
Based on the above, what goals should a full-stack tracing component meet? Google Dapper highlights requirements that can be summarized as:
Low probe overhead
APM components must have minimal impact on service performance. Instrumentation inherently introduces overhead, so tracing should be low-cost. In practice, sampling is often used to analyze only a subset of requests. For highly optimized services even tiny overheads are noticeable and may force teams to disable tracing.
Low invasiveness
As an application component, tracing should be minimally or non-invasive to other systems and transparent to developers, reducing their burden. Developers should not need to be aware of the tracing system for it to work. If a tracing system requires explicit developer changes to applications to function, it becomes fragile and hard to deploy universally.
Scalability
An effective tracing system must support distributed deployment and horizontal scalability. Supporting more components is desirable, or the system should provide a simple plugin API so developers can extend support for unmonitored components.
Fast and rich data analysis
Analysis should be fast and cover many dimensions. Rapid feedback enables quick reactions to production anomalies. Broad analysis capability avoids repeated development.
Functional modules
A typical full-stack tracing system can be divided into four major functional modules:
Instrumentation and log generation
Instrumentation captures context at each node and can be client-side, server-side, or bidirectional. Logs typically include traceId, spanId, start time, protocol type, caller IP and port, target service name, duration, result, exception information, and extensible fields for future use.
Instrumentation must not impose unacceptable performance cost. High QPS increases impact, so sampling and asynchronous logging are common mitigations.
Log collection and storage
Support distributed log collection with messaging queues used as buffers. Typically a daemon on each host collects trace logs from the business process and forwards them upstream. Multi-level collectors, similar to pub/sub, provide load balancing. Aggregated data is analyzed in real time and stored offline. Offline analysis must aggregate logs belonging to the same call chain.
Analysis and statistics of call chain data
Call trace analysis: group spans with the same trace ID, sort by time to form a timeline. Linking ParentID values reconstructs the call stack. Log trace IDs on exceptions or timeouts so querying trace ID reveals the call chain for diagnostics.
Dependency metrics:
- Offline analysis: aggregate by trace ID and rebuild call relations via span ID and parent ID to analyze chain shapes.
- Real-time analysis: analyze individual logs without aggregation to get current QPS and latency.
- Strong dependency: call failure directly interrupts the main flow.
- High probability dependency: a dependency is often called in the chain.
- Frequent dependency: the same dependency is called multiple times in a chain.
Visualization and decision support
Dashboards and topology views to support operations and optimization decisions.
Google Dapper concepts
Span
The basic unit of work. A span represents a single logical operation in the trace (RPC, DB call, etc.) and is identified by a 64-bit ID. A span contains other data such as description, timestamps, key-value annotations (tags), and parent_id indicating the caller span.
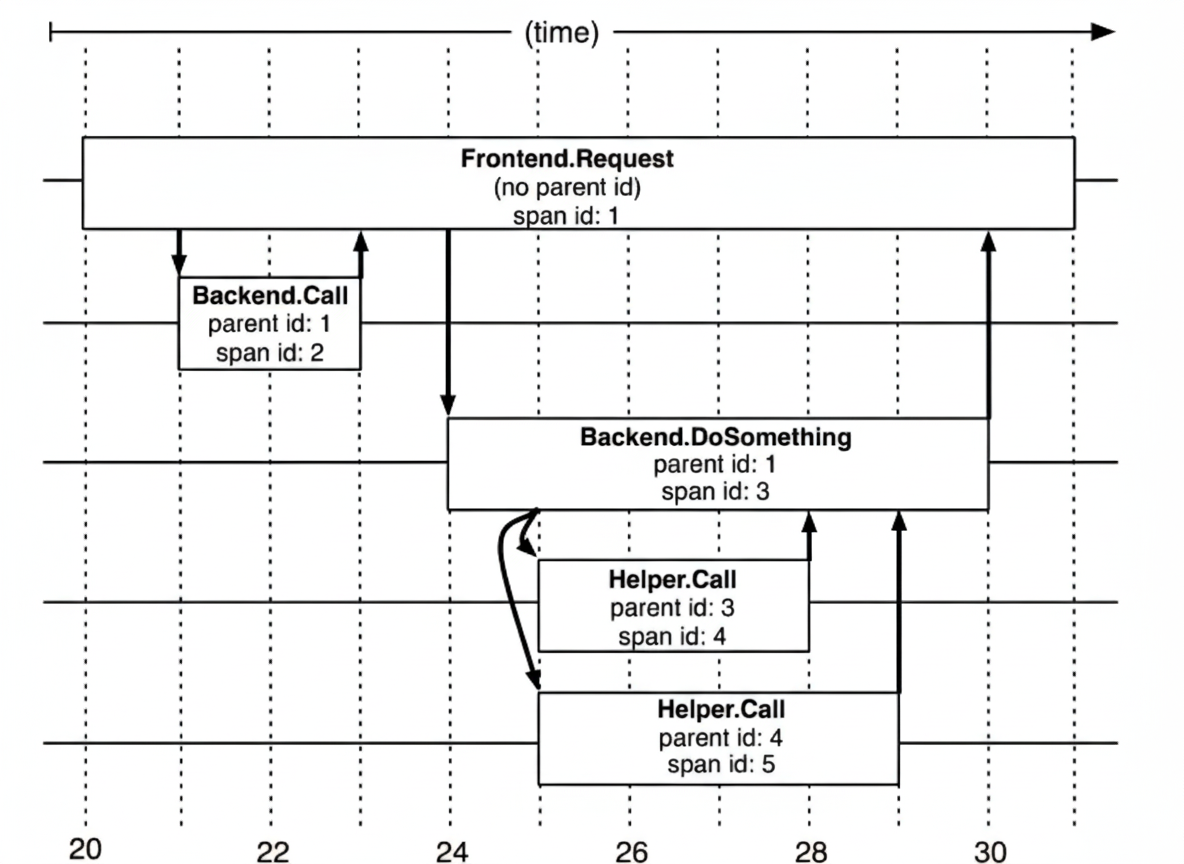
Dapper records the span name and each span's ID and parent ID to reconstruct relationships. A span without a parent ID is a root span. All spans belong to a specific trace and share a trace ID.
Span data structure example:
type Span struct { TraceID int64 // used to identify a complete request id Name string ID int64 // span_id of this call ParentID int64 // span_id of the caller; top-level span has null parent_id Annotation []Annotation // timestamped annotations Debug bool }
Trace
A trace is a tree-structured collection of spans representing a complete end-to-end request, from client request arrival to server response. Each trace has a unique trace_id.
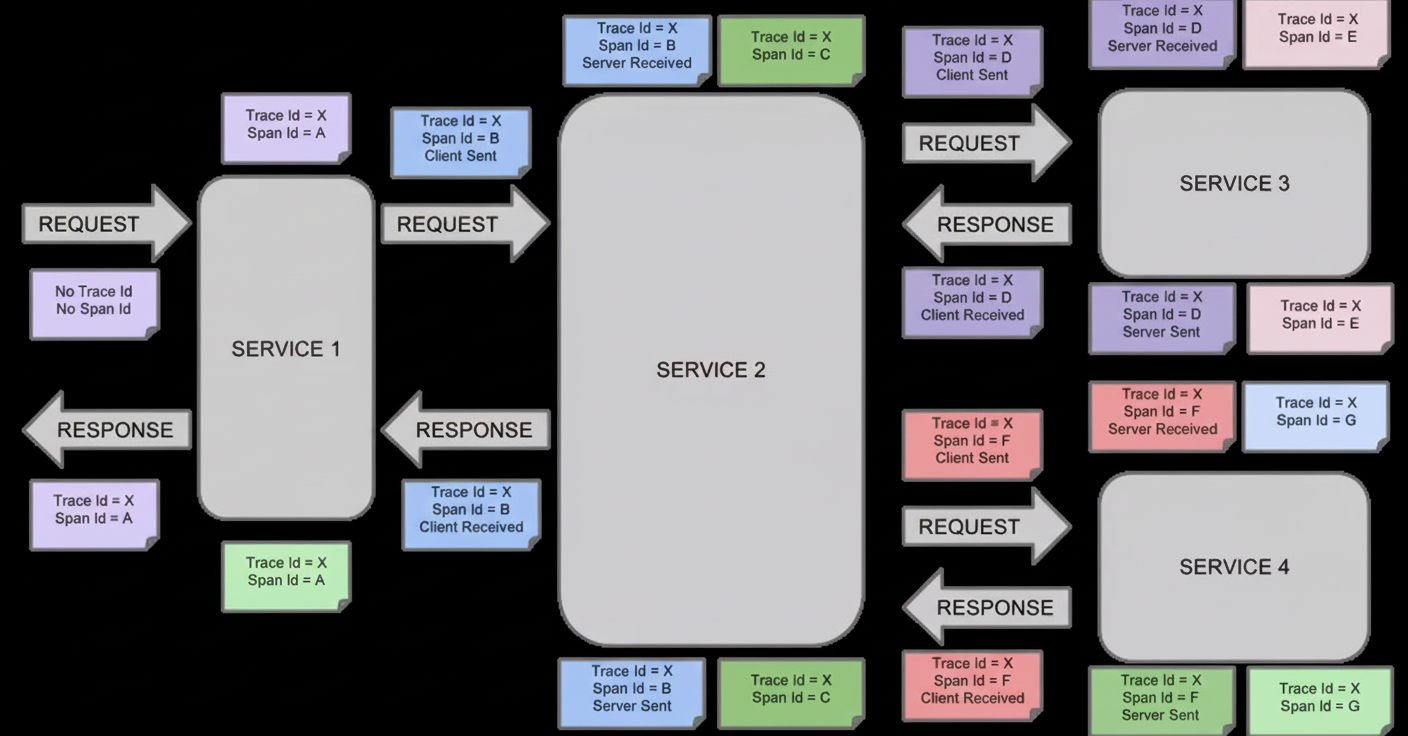
Annotation
Annotations record event-related information for a request (for example timestamps). A span typically contains multiple annotations. Common annotation events:
- cs: Client Start (client sent request)
- sr: Server Receive (server received request)
- ss: Server Send (server completed processing and sent response)
- cr: Client Received (client received response)
Annotation data structure example:
type Annotation struct { Timestamp int64 Value string Host Endpoint Duration int32 }
Example call
When a user request arrives at frontend service A, A calls services B and C via RPC. B responds to A quickly, while C must interact with backend services D and E before returning to A. A then responds to the user.
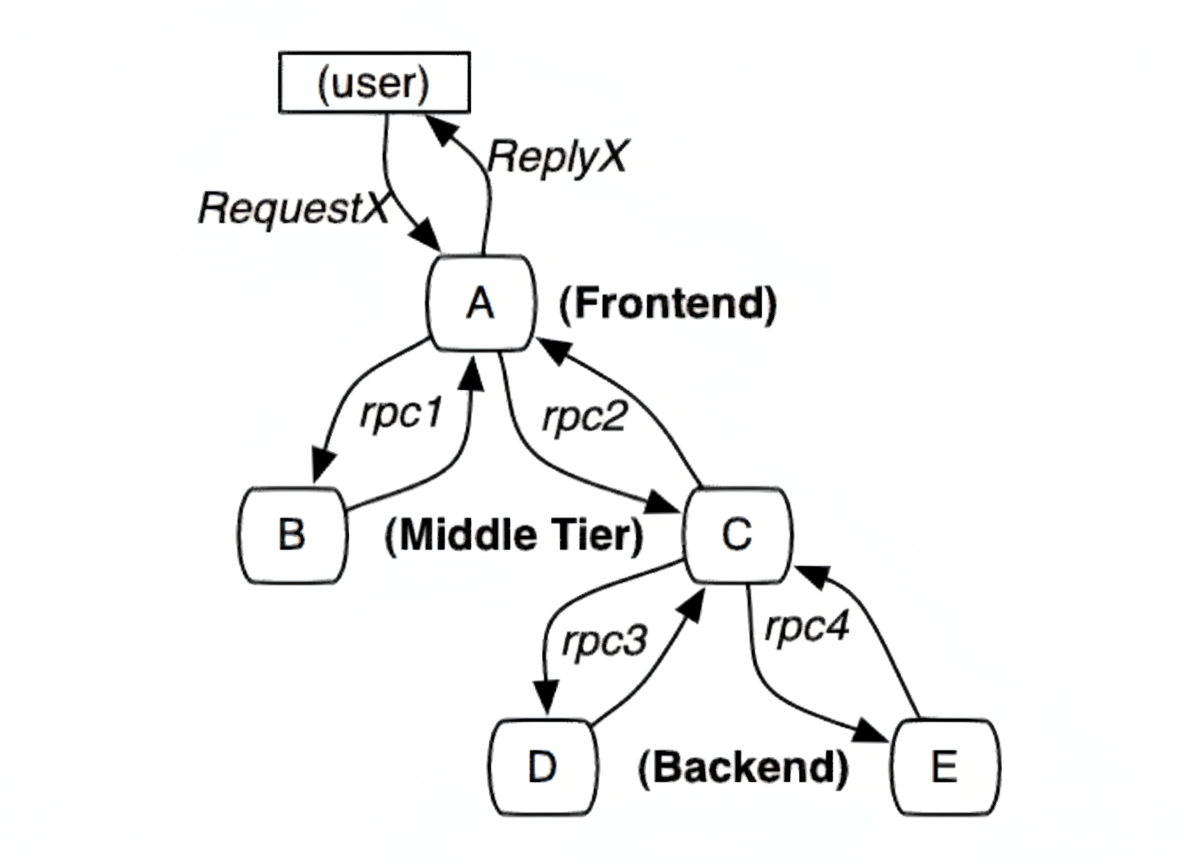
The request is assigned a global TraceID used to link the entire call chain. SpanID records parent-child relationships. Each service logs parent id and its own span id. A span without parent id is the root span. All IDs are globally unique 64-bit integers. TraceID and SpanID must be propagated on each call. To view a complete call, query all records by TraceID and reconstruct parent-child relationships using parent id and span id.
Core tracing tasks
- Trace data generation: instrument applications and output trace logs.
- Trace data collection: collect logs from applications.
- Trace data storage and query: store collected data and provide fast queries for large log volumes.
- Metric computation, storage, and query: compute metrics from logs and persist results.
- Alerting: provide threshold-based alerts.
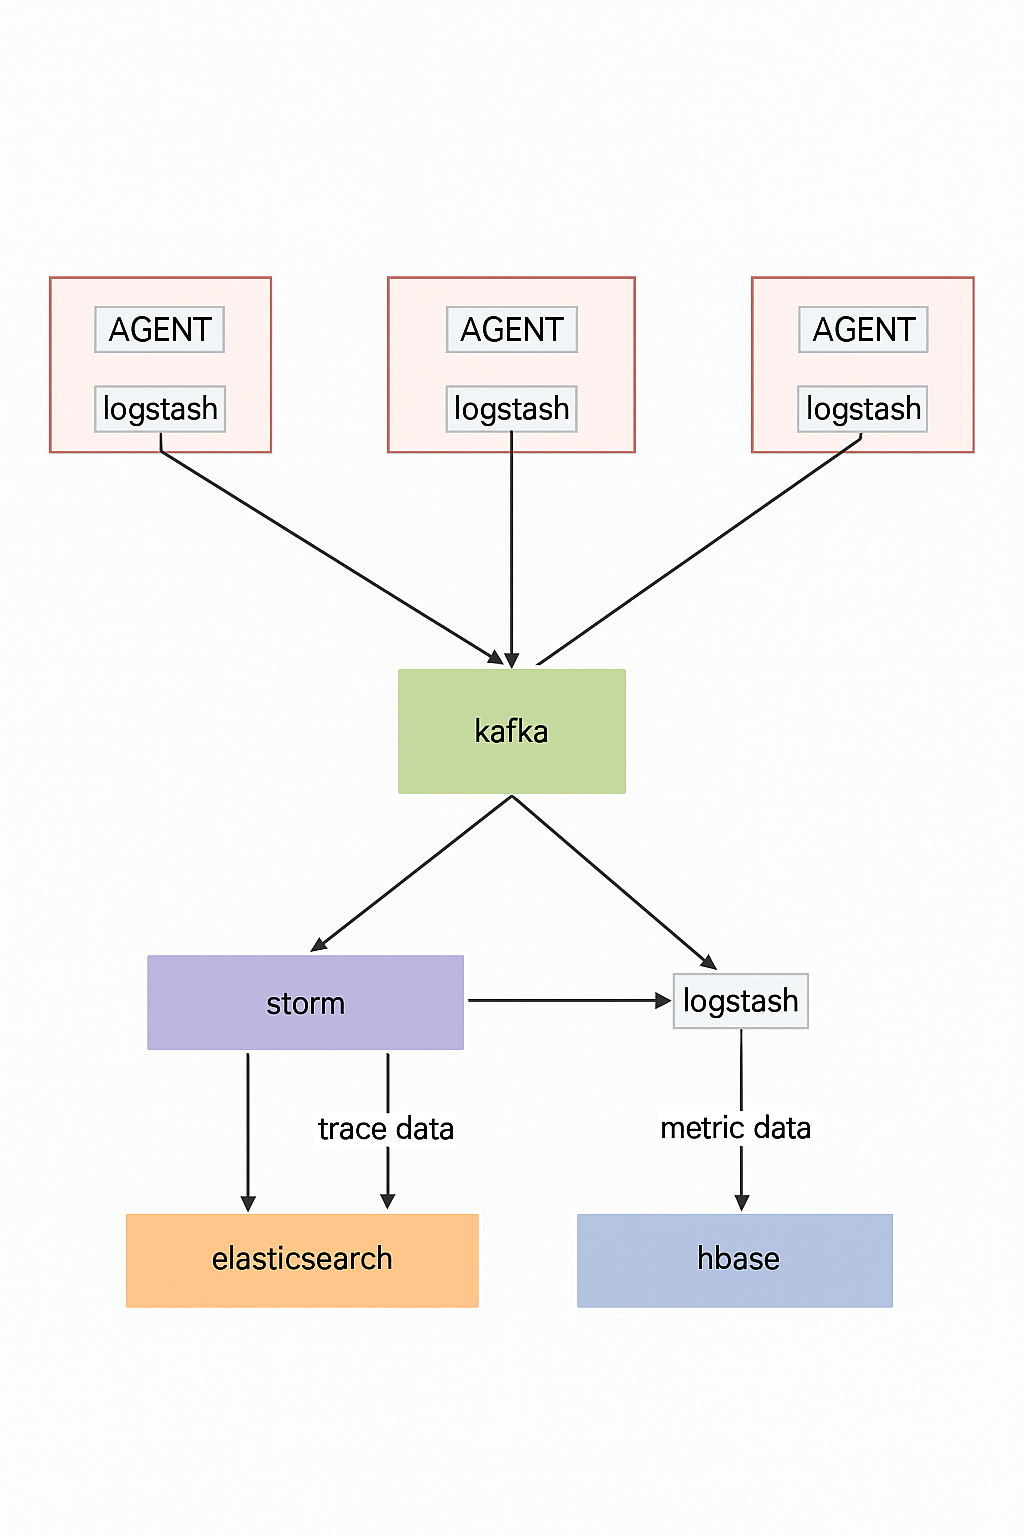
Typical deployment:
- AGENT generates trace logs.
- Logstash collects logs into Kafka.
- Kafka supplies data to downstream consumers.
- Storm aggregates metrics and writes to Elasticsearch.
Storm extracts trace data and stores it in Elasticsearch to support complex queries like time-based trace searches. Logstash pulls raw Kafka data into HBase; HBase uses traceID as the rowkey for fast retrieval by traceID.
Agent-based non-invasive deployment
Agent proxies enable non-invasive deployment, separating performance measurement from business logic and allowing measurement of arbitrary methods. Agents reduce operational cost and improve collection efficiency. Agents are generally classified by service span:
- In-process agent: for example, a Java agent collects method-level call hierarchy, execution times, parameters, and return values.
- Cross-service agent: plugin-based support for mainstream RPC frameworks and a standard data format to support custom RPC frameworks.
Common cross-service support includes:
- Dubbo support
- REST support
- Custom RPC support
Benefits of call chain monitoring
- Accurate visibility into production deployments.
- Identify and optimize key call chains from an end-to-end performance perspective.
- Provide traceable performance data to quantify the value of IT operations.
- Rapidly locate code performance issues to assist developers.
- Assist developers in white-box testing and reduce stabilization time after deployments.
Solution comparison
Most commercial full-stack tracing models are based on Google Dapper. This article focuses on three APM components:
- Zipkin: open-source tracing system originally developed by Twitter for collecting timing data to troubleshoot latency in microservices, covering data collection, storage, search, and display.
- Pinpoint: an APM tool for large-scale Java distributed systems originally open-sourced by a Korean team.
- SkyWalking: an APM component developed in China for tracing, alerting, and analyzing Java distributed applications.
Comparison criteria include probe performance, collector scalability, comprehensiveness of call chain analysis, developer transparency and toggling, and topology completeness.
Probe overhead
Probe overhead affects throughput, CPU, and memory. Microservices scale and change rapidly, increasing collection costs. Benchmarking of SkyWalking, Zipkin, and Pinpoint was performed versus a baseline without probes.
Test application: a common Spring-based app (Spring Boot, Spring MVC, Redis client, MySQL). Each trace captured five spans (Tomcat, SpringMVC, two Jedis spans, and MySQL). Three concurrency levels were simulated: 500, 750, and 1000 users. JMeter was used, each thread sent 30 requests with 10ms think time. Sampling rate was set to 100% for tests, though production may sample less. Pinpoint default is 50% (20%? varies by versions) so it was adjusted to 100% for fair comparison; Zipkin default was 100% in this test.
From the tests, SkyWalking's agent had the smallest impact on throughput, Zipkin had medium impact, and Pinpoint had the largest impact. For 500 concurrent users Pinpoint reduced throughput from 1385 to 774. CPU and memory differences were around 10% on internal test servers.
Collector scalability
Collectors must scale horizontally to support large clusters.
Zipkin: zipkin-server and agents communicate over HTTP or MQ; HTTP may affect normal traffic so MQ-based asynchronous communication is recommended. Multiple zipkin-server instances can consume from MQ topics for scalability.
SkyWalking: collectors support standalone and cluster modes. Agent-to-collector communication uses gRPC.
Pinpoint: supports both cluster and standalone deployment. Pinpoint agents communicate with collectors using Thrift.
Comprehensiveness of call chain analysis
Zipkin provides trace views down to service or interface level, but its granularity is relatively coarse compared to alternatives.
SkyWalking supports 20+ middleware, frameworks, and libraries (e.g., Dubbo, OkHttp, DB and messaging middleware). Because of wider middleware support, SkyWalking's trace analysis is more complete than Zipkin in many cases.
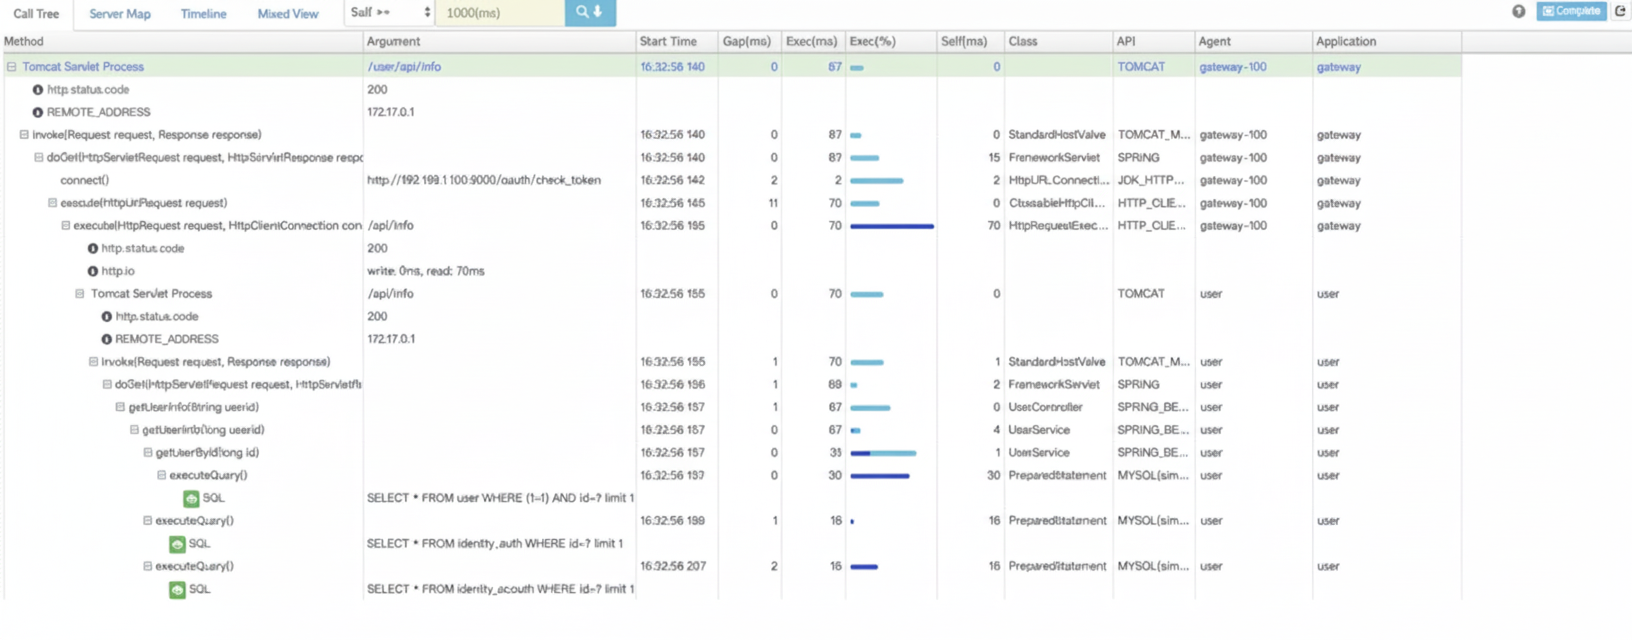
Pinpoint provides the most detailed analysis among the three, offering code-level visibility to locate failures and bottlenecks. For example, executed SQL is recorded, and alert rules and owner settings per application are supported. Pinpoint also supports a comprehensive set of frameworks and middleware.
Developer transparency and toggling
Ideally, tracing should work without code changes and still provide code-level visibility. Zipkin's Brave uses application-level APIs and often requires code modification or integration. SkyWalking and Pinpoint use bytecode enhancement, so developers do not need to change code and more precise data can be collected from bytecode-level information.
Topology visualization
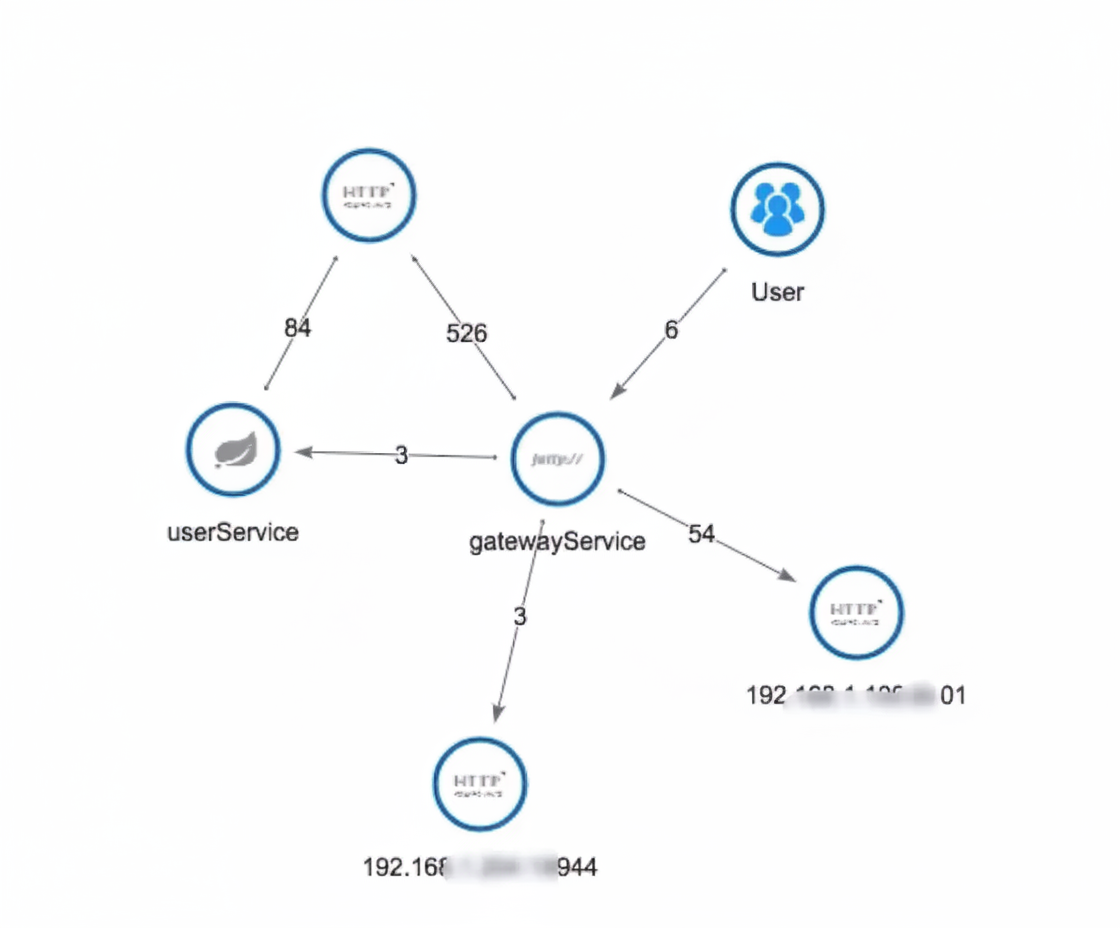
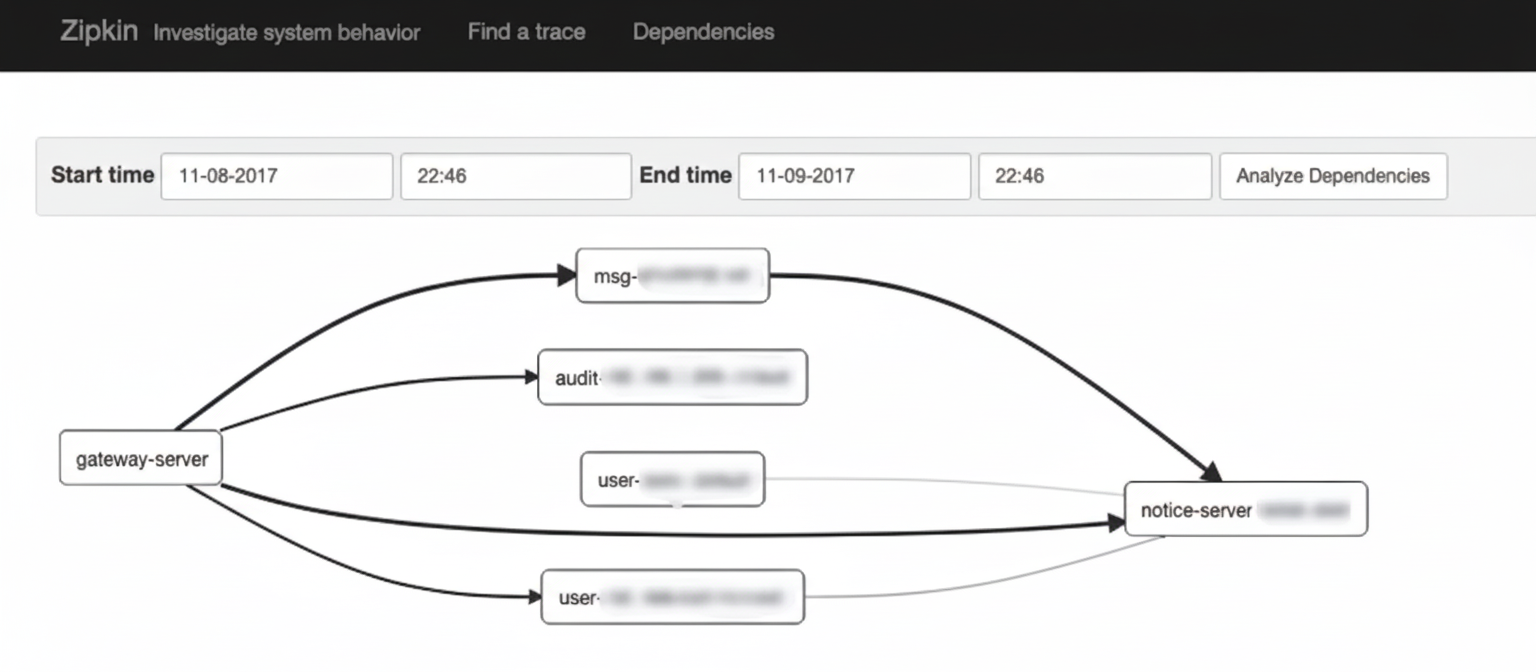
All three provide automatic application topology detection to clarify architecture. Pinpoint's UI tends to display richer details (e.g., DB names), while Zipkin's topology focuses on service-to-service relationships.
Pinpoint vs Zipkin detailed comparison
Differences
Pinpoint is a complete performance monitoring solution including probes, collectors, storage, and a web UI. Zipkin focuses on collectors and storage; although it has a UI, it is not as feature-rich as Pinpoint. Zipkin provides query APIs that enable system integration and custom UIs.
Zipkin offers a Finagle-based interface (Scala) officially; other framework integrations are community contributions and Zipkin supports many languages and frameworks. Pinpoint officially provides a Java agent; other language support relies on community contributions.
Pinpoint's Java agent uses bytecode injection to intercept calls and collect data, enabling non-invasive deployment by adding startup parameters. Zipkin's Java implementation Brave exposes application-level APIs, requiring code modification or framework integration for similar visibility.
Pinpoint's backend storage is HBase, while Zipkin commonly uses Cassandra.
Similarities
Both are based on the ideas in Google Dapper: splitting calls into cascaded spans linked by SpanId and ParentSpanId and aggregating spans into traces for collectors to store.
Pinpoint extends the model (e.g., TransactionId, SpanEvent) and typically records more trace data by default. Brave could theoretically record method-level spans too, but its common implementations do not.
Bytecode injection vs API-based tracing
Bytecode injection is a powerful method that can intercept nearly any method call. Brave's API approach depends on underlying framework support to intercept calls; some drivers or libraries provide interceptor hooks while others do not, making interception harder. Bytecode injection is more generic but requires deeper integration effort.
Effort and cost
Brave is easier to understand and quick to start with due to limited core code. Pinpoint provides high-level APIs for bytecode injection but requires familiarity with bytecode instrumentation concepts. For integrating across many systems, the initial plugin development cost and integration costs differ: Pinpoint plugin development cost may be higher up front but integration cost per system can be lower compared to Brave, depending on the number of systems.
Extensibility
Pinpoint has fewer community-developed integration interfaces and its data protocol (Thrift) increases integration complexity compared to HTTP/JSON-based systems. This can disadvantage Pinpoint's ecosystem extensibility.
Community support
Zipkin has strong community backing, while Pinpoint has a smaller core team. Fewer community plugins make Pinpoint more dependent on its own team for framework integrations.
Other considerations
Pinpoint was designed with performance in mind; high-traffic services at scale influenced choices like compact binary protocols and UDP transport. These optimizations increase complexity, e.g., Thrift usage, UDP transport, and constant dictionaries. Zipkin uses familiar REST/JSON interfaces which simplify integration.
Pinpoint historically lacked fine-grained sampling capabilities, which are essential for high-volume production environments. Both Pinpoint and Brave support a sampling percentage, but Brave also provides a Sampler interface for custom strategies (useful for scenarios like A/B testing).
Summary
In the short term, Pinpoint has advantages: deployable without code changes, method-level tracing, and a powerful UI with broad Java framework support. Long term, the learning curve and cost of implementing and maintaining adapters for many frameworks is uncertain. Brave is easier to master and Zipkin's larger community increases the likelihood of more integrations. If needed, AOP can be used to instrument code with less complexity than bytecode injection.
Tracing vs Monitoring
Monitoring can be divided into system monitoring and application monitoring. System monitoring includes CPU, memory, network, disk, and process-level metrics that can be obtained directly from the OS. Application monitoring requires applications to expose metrics, such as application-level QPS, latency, error counts, message queue lengths, crashes, and GC metrics. Monitoring's main goal is anomaly detection and alerting.
Tracing is centered on call chains. Many metrics are derived from call chain analysis. Tracing's main goal is system analysis and proactive problem detection; finding issues earlier is better than reacting after they occur. Tracing and application monitoring share data collection, analysis, storage, and visualization, but differ in collected dimensions and analysis methods.