Overview of Bearing Fault Diagnosis in Industrial Applications
Bearings are critical components in rotating machinery across industrial control systems, motors, pumps, gearboxes, and automation equipment. Early fault detection prevents unplanned downtime, reduces maintenance costs, and enhances overall equipment effectiveness (OEE). Common diagnostic approaches include abnormal sound analysis, vibration signal analysis, temperature monitoring, lubricant analysis, and acoustic emission testing. Each method provides unique insights into bearing health, with varying sensitivity to different failure modes such as pitting, spalling, wear, corrosion, or lubrication issues.
Selecting and integrating the right diagnostic techniques depends on operating conditions, machine criticality, and system architecture. In modern industrial environments, these methods increasingly rely on robust sensor networks, data acquisition electronics, and reliable printed circuit boards (PCBs) for signal integrity and long-term performance.
Vibration Signal Analysis: The Cornerstone of Bearing Condition Monitoring
Vibration analysis is the most widely used and effective method for bearing fault diagnosis due to its sensitivity to mechanical defects. Faults like spalling, dents, cracks, or wear generate characteristic frequency components that can be measured and analyzed.
Simple Diagnostic Techniques
Simple methods compare overall vibration metrics against thresholds:
- Amplitude-value diagnosis (peak, mean, RMS): Peak values detect impulsive faults like pitting; RMS suits gradual wear.
- Kurtosis and crest factor: These statistical indicators rise with impact-type faults and are relatively independent of speed and load.
- Probability density analysis: Deviations from Gaussian distribution signal emerging issues.
Baseline measurements under normal conditions are essential, as absolute thresholds vary by machine type, sensor location, and operating parameters.
Precision Diagnostic Methods
Advanced analysis examines frequency content:
- Low-frequency analysis (<8 kHz): Focuses on velocity signals for overall machine health.
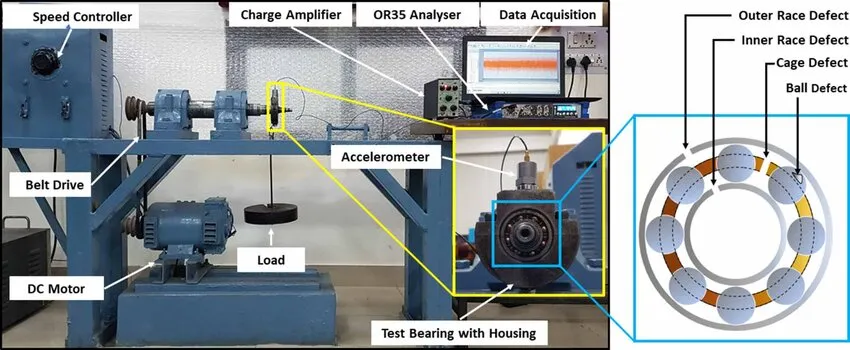
- Mid- and high-frequency demodulation (envelope analysis): Isolates bearing-specific defect frequencies (e.g., ball pass frequency outer/inner race - BPFO/BPFI, ball spin frequency - BSF).
Signal processing techniques, including FFT and time-frequency methods, help separate fault signatures from background noise.
Engineering Considerations: Sensor mounting, cabling, and electronics must maintain signal fidelity in noisy industrial environments. High-quality accelerometers and vibration monitoring systems require stable power supplies, low-noise amplification, and robust PCBs capable of withstanding mechanical stress and thermal cycling.
Temperature Monitoring for Early Fault Detection
Bearing temperature provides a direct indicator of lubrication effectiveness, overload, or misalignment. Surface measurements on the housing or outer ring (via oil holes) are common. Normal operation shows a gradual rise to steady state within 1-2 hours; rapid increases signal problems.
Key causes of elevated temperatures include inadequate/excessive lubrication, contamination, insufficient clearance, or seal friction. Prolonged operation above ~125.C significantly shortens bearing life.
Continuous monitoring with integrated sensors is recommended for critical assets. Temperature data complements vibration analysis, as thermal effects can accelerate mechanical degradation.
PCB and Electronics Relevance: Temperature sensors (RTDs, thermocouples, or thermistors) integrate into condition monitoring boards. High-reliability PCB designs with proper thermal management, trace routing for minimal self-heating, and conformal coatings ensure accurate readings in harsh environments.
Abnormal Sound (Acoustic) Analysis
Audible inspection uses tools like electronic stethoscopes or listening rods to detect changes in rotational noise. Normal bearings produce smooth, uniform whooshing sounds. Abnormal patterns include:
- Hissing (insufficient grease or clearance issues).
- Periodic rumbling (surface damage on races or elements).
- Scraping (contamination).
- Rasping (loose fits).
While simple and low-cost, this method is subjective and less effective for early-stage or high-speed applications. It serves well as a supplementary technique.
Lubricant Analysis (Ferrography and Oil Condition Monitoring)
Analyzing lubricant samples reveals wear debris and contamination. Ferrography uses magnetic fields to separate particles by size and type on a slide for microscopic examination. Spherical particles (1-5 um) indicate early fatigue; larger flakes signal advanced damage.
This offline method provides insights into wear mechanisms not easily captured by vibration or temperature alone.
Acoustic Emission (AE) Testing
Acoustic emission detects high-frequency elastic waves from material deformation, cracking, or friction. Burst-type signals indicate discrete events (e.g., pitting or particle impacts); continuous signals suggest broader issues like lubrication failure.
AE excels at early detection of subsurface damage and complements vibration analysis, particularly in low-speed or noisy environments.
Design and Manufacturing Considerations for Reliable Condition Monitoring Systems
Effective bearing fault diagnosis systems depend on high-performance electronics. Vibration sensors, data acquisition modules, and edge processors must deliver clean signals in electrically and mechanically demanding settings.
PCB Design Challenges and Best Practices:
- Vibration Resistance: Reinforced or rigid-flexPCBs, strategic component placement away from high-strain areas, and proper mounting reduce resonant failures. Damping materials and secure fixation minimize false readings or component detachment.
- Signal Integrity: Controlled impedance traces, shielding, and low-noise layouts are critical for accelerometer and AE sensor signals.
- Thermal Management: Effective heat dissipation in sensor interfaces and processors prevents drift in temperature monitoring circuits.
- Reliability Engineering: Conformal coatings, high-Tg materials, and HDI techniques enhance durability in industrial control environments. Rigorous testing (vibration, thermal cycling, shock) ensures long-term performance.
- Integration: Compact, multi-sensor PCBs enable combined vibration-temperature-acoustic monitoring, supporting IoT-enabled predictive maintenance.
Manufacturing high-reliability electronics for these systems requires expertise in materials selection, assembly processes, and quality assurance to meet industrial standards.
Industry Trends and Applications
Predictive maintenance powered by multi-sensor fusion and advanced analytics (including machine learning) is transforming industrial control. Integration of MEMS sensors, wireless connectivity, and edge computing allows real-time health monitoring across smart factories.
Applications span automotive, aerospace, energy, robotics, and heavy machinery - where bearing reliability directly impacts safety and productivity. Electronics and PCB technologies form the backbone of these systems, enabling scalable, cost-effective deployment.
In industrial electronics manufacturing, robust PCBs ensure that monitoring hardware itself remains reliable under the same harsh conditions as the equipment it protects.
Frequently Asked Questions
Q1: What is the most effective method for early bearing fault detection?
A1: Vibration analysis, particularly with envelope demodulation, combined with temperature monitoring offers excellent early warning capabilities for most industrial applications.
Q2: How do PCBs contribute to bearing condition monitoring systems?
A2: PCBs provide the platform for sensor signal conditioning, data processing, and communication in vibration analyzers, IoT gateways, and control modules, requiring specialized design for vibration, thermal, and EMI resilience.
Q3: When should lubricant analysis be used?
A3: As a complementary offline method for detailed wear particle analysis, especially when investigating root causes or in systems with accessible lubrication circuits.