Overview
A Bode plot is commonly used to analyze a system's frequency response. It graphically shows amplitude and phase across a range of frequencies, which helps to understand circuit behavior. In general, Bode plots provide a clear and intuitive view of a circuit's frequency-response characteristics and are a valuable tool for circuit analysis, design, optimization, and troubleshooting.
Bode plots can be produced by collecting amplitude and phase measurements at different input signal frequencies and plotting the results. When many data points are collected, software such as Excel, MATLAB, or Python can be used to draw the plots.
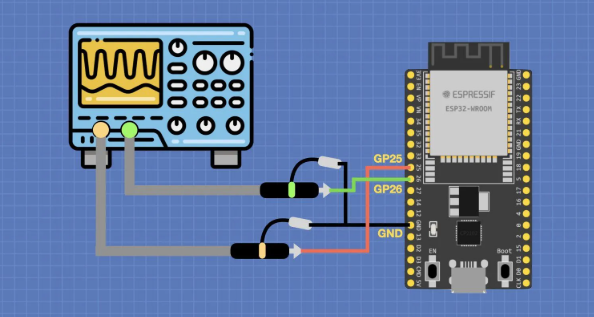
Series 2 mixed-signal oscilloscopes offer optional 2-SOURCE or 2-UL TI MATE configurations and include a built-in function generator and Bode-plot capability. For Series 4/5/6 mixed-signal oscilloscopes, the Bode-plot function requires the power measurement and analysis option (PWR). Power measurements and analysis can be used to derive control-loop response measurements.
Some Tek oscilloscopes include a built-in function generator and Bode-plot capability, which automates changing the generator output frequency, capturing input and output signals, and generating the Bode plot.
What Is a Bode Plot
A Bode plot consists of two graphs: a magnitude (gain) plot and a phase plot. These graphs show how the system responds at different frequencies and provide insight into gain and phase characteristics.
The magnitude plot uses a logarithmic frequency scale to represent amplitude as a function of frequency. A logarithmic scale allows the frequency axis to span several decades without losing resolution, compressing higher frequencies toward the right side of the plot for a more uniform representation.
The phase plot shows phase shift in degrees and indicates the amount and direction of phase change. Phase is typically represented from -180° to 180°. The phase plot complements the magnitude plot and provides a more complete view of the system's frequency response.
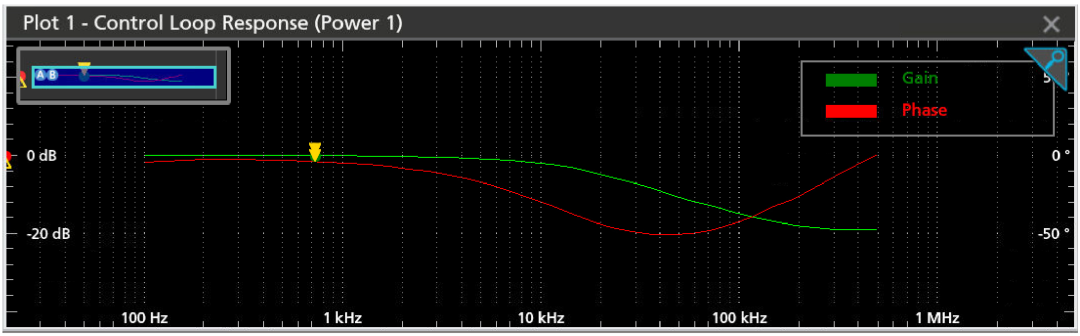
Figure 1: Gain and phase plots on a Series 2 mixed-signal oscilloscope
Applications of Bode Plots
Bode plots provide several types of insight for circuit analysis, including:
1. Gain and Attenuation
Bode plots show how a circuit amplifies or attenuates signals at different frequencies. The magnitude plot reveals overall gain or loss and identifies frequency-dependent behavior.
2. Bandwidth
Bandwidth is the frequency range over which a circuit performs effectively. By inspecting the magnitude plot, you can determine the frequencies where gain falls to a specified level (for example, -3 dB), representing the usable bandwidth.
3. Filter Analysis
Bode plots are useful for analyzing low-pass, high-pass, band-pass, and band-stop filters. They show cutoff frequencies, roll-off rates, and passband/stopband characteristics, aiding filter design and verification.
4. Phase Response
The phase plot shows the phase shift introduced by a circuit at different frequencies. This information is important for systems with time delay or phase-sensitive applications such as audio signal processing and feedback control systems.
5. Stability Analysis
Bode plots are used to analyze the stability of feedback control systems. Open-loop analysis, which examines only the open-loop transfer function, is a common simplification for stability assessment. Engineers can use the magnitude and phase plots to determine gain margin and phase margin, which quantify stability and robustness to disturbances and parameter variations.
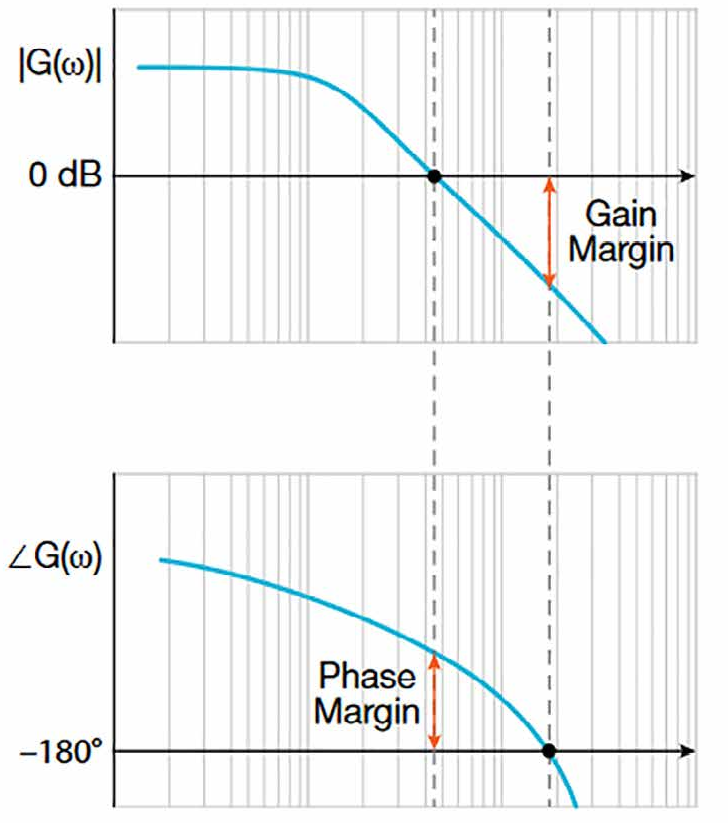
Figure 2: Gain and phase margin
6. Resonance and Frequency Selectivity
Bode plots help identify resonant frequencies and frequency-selective behavior, especially in systems that include reactive components such as capacitors and inductors. Peaks in the magnitude plot indicate resonances, and the phase plot shows the related phase shifts.
Generating a Bode Plot on a Series 2 Mixed-Signal Oscilloscope
The following example uses a simple first-order passive low-pass RC filter to demonstrate how to generate a Bode plot on a Series 2 mixed-signal oscilloscope. The filter consists of a resistor in series with a capacitor.
The RC network uses a 10 Ω resistor and a 1 μF capacitor.
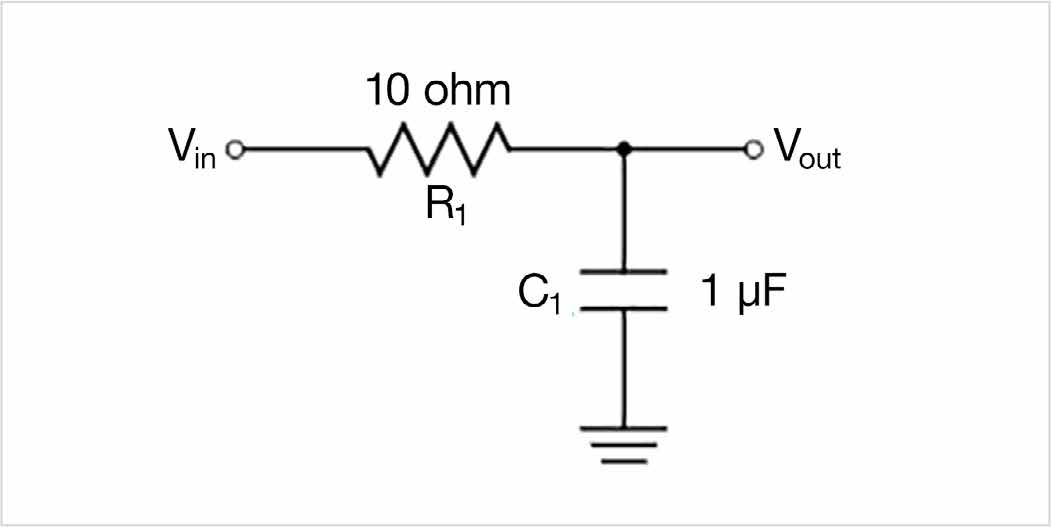
Figure 3: Simple passive low-pass RC filter
Calculate the cutoff frequency using the standard RC formula.
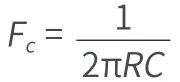
The cutoff frequency for this network is approximately 16 kHz.
To start a Bode plot on a Series 2 mixed-signal oscilloscope, add a new measurement and select the FRA option on the measurements tab. Use the built-in AFG or an external Tek AFG (AFG31000) to configure the Bode plot. The built-in AFG supports signals up to 50 MHz.
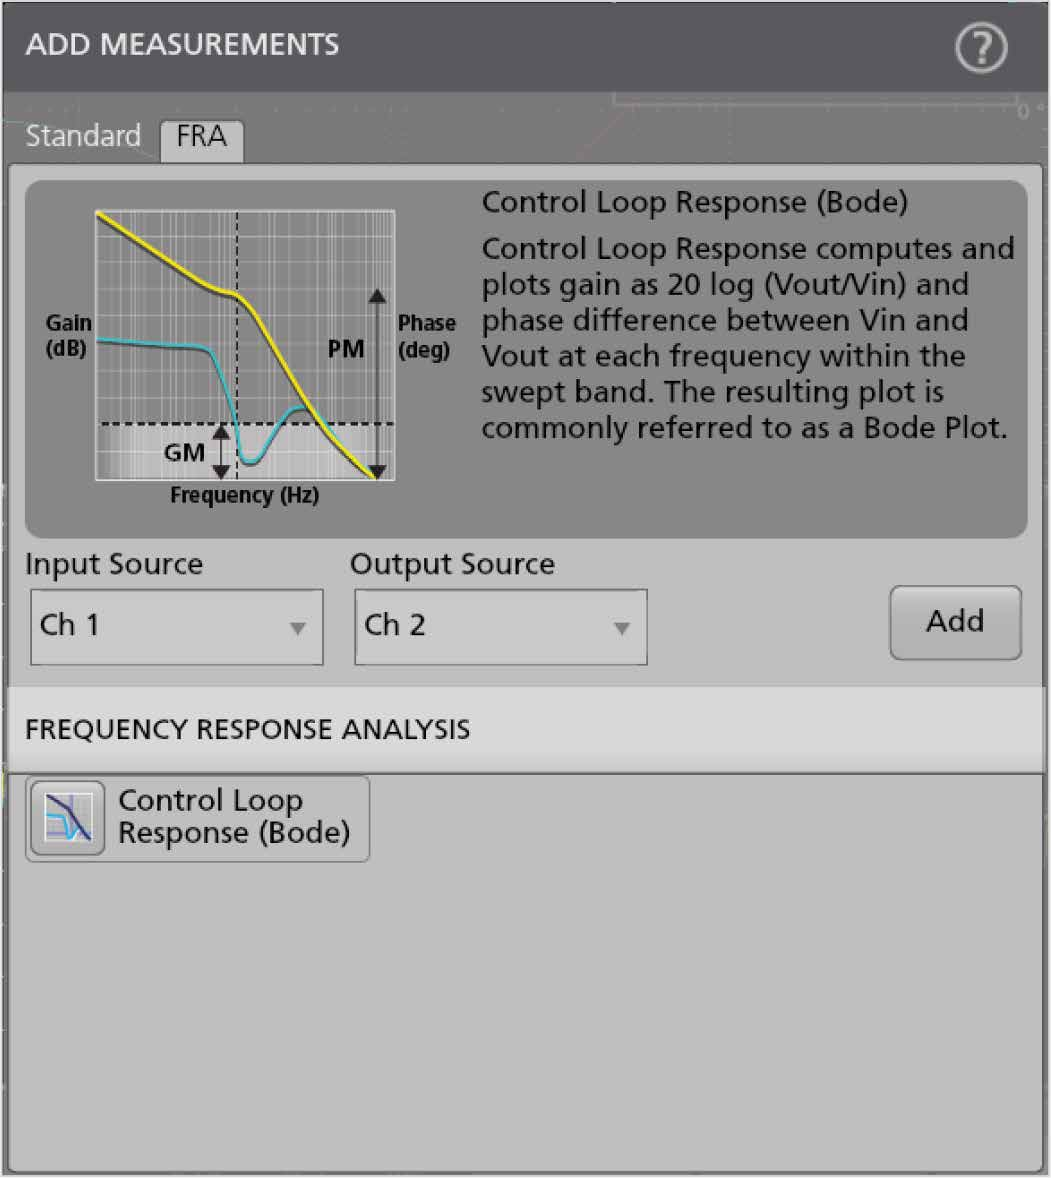
Figure 4: Start the Bode plot by adding a new measurement
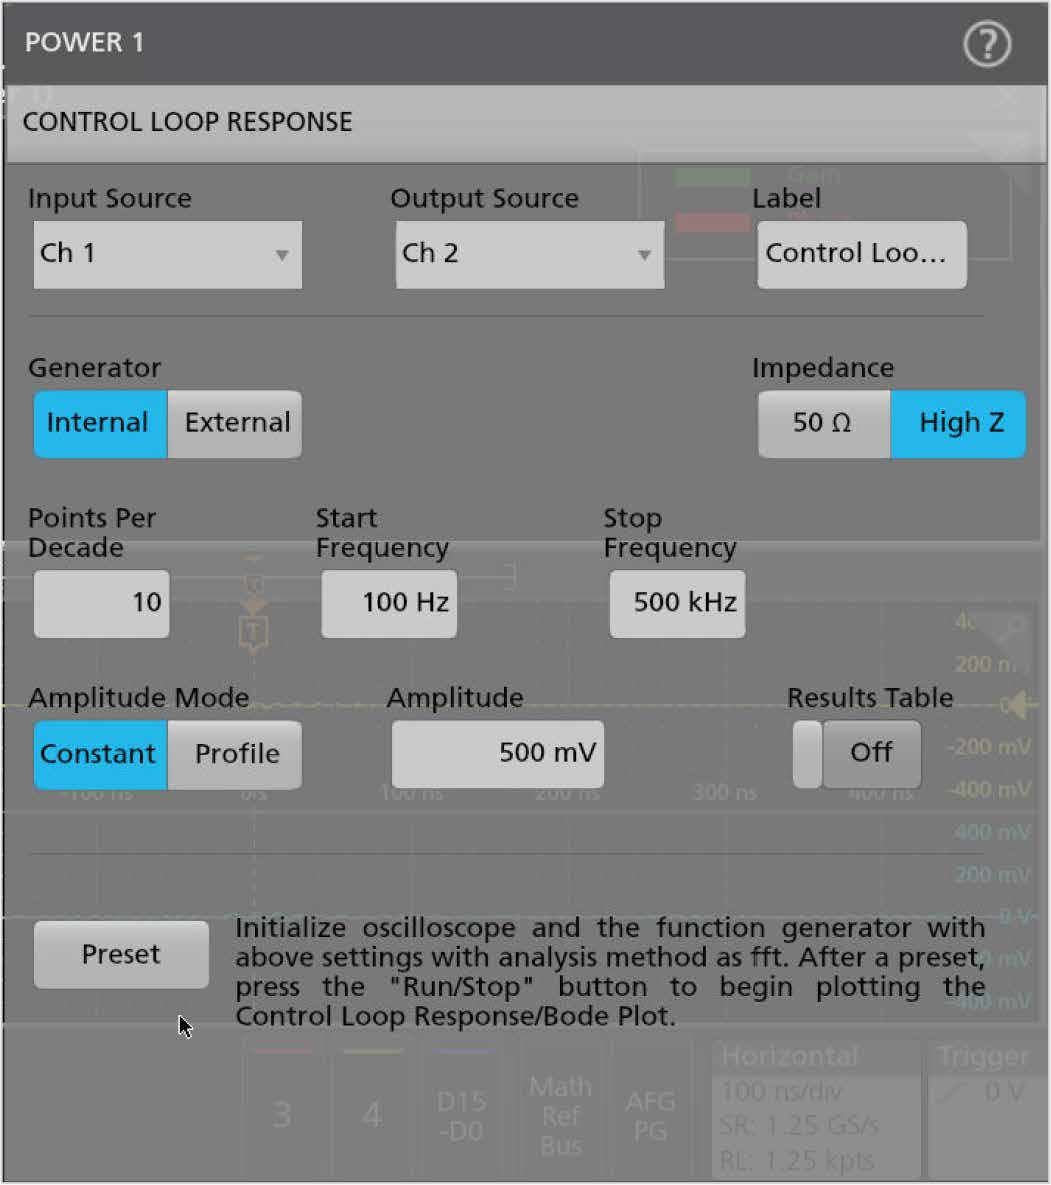
Figure 5: Bode plot configuration using the built-in function generator
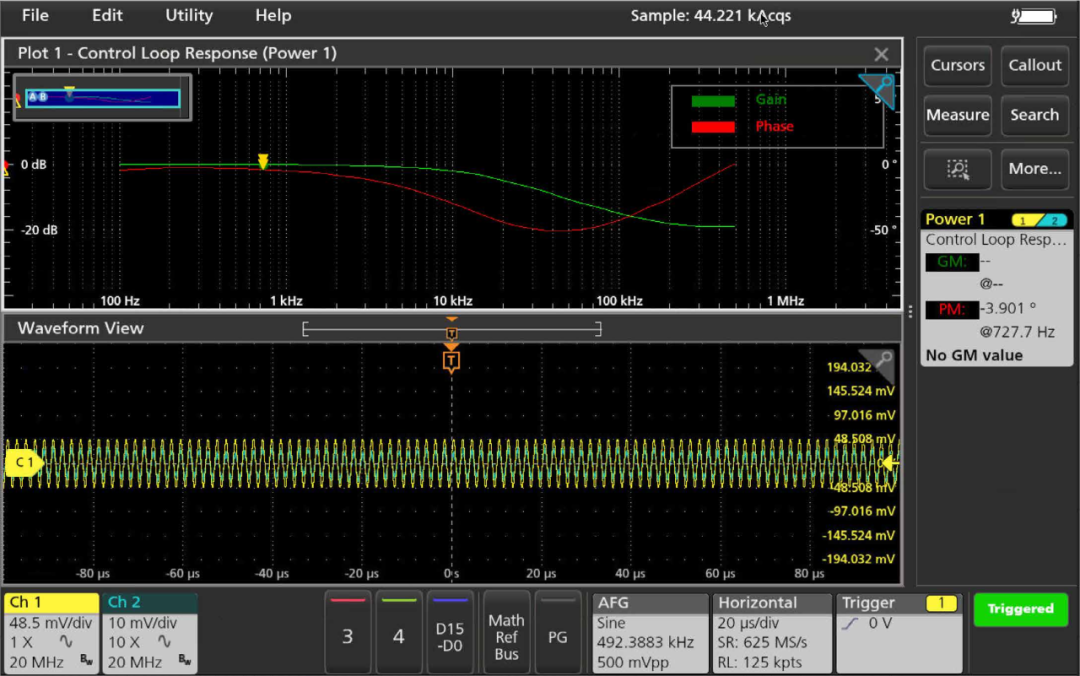
Figure 6: Bode plot for a low-pass filter with a 16 kHz cutoff
Set the start and stop frequencies to define the scan range. "Points/decade" specifies the data point density; a reasonable range is 5 to 10 points per decade. The default is 10 points per decade.
After configuring the settings, press the preset button to apply the AFG settings and initialize the oscilloscope. Press the front-panel Run/Stop button or use the on-screen Run/Stop control to begin data acquisition and plotting.
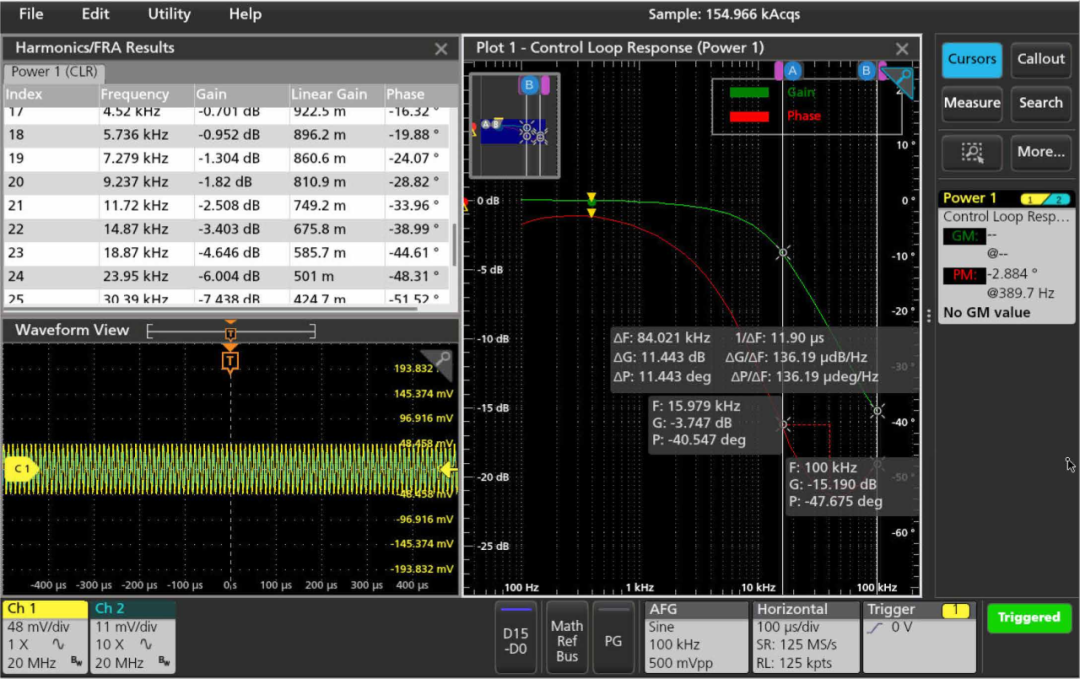
Figure 7: Use cursors and the results table to examine measurement details
Use cursors and the results table to obtain detailed information from the Bode plot. For the simple RC network with 10 Ω and 1 μF, the measured cutoff frequency is about 16 kHz, matching the calculation. The phase plot shows approximately -40° near the cutoff, close to the ideal -45°. The magnitude plot also shows the expected roll-off near the cutoff frequency.
Series 2 mixed-signal oscilloscopes provide built-in Bode-plot functionality and optional battery power for portable measurement use.