Introduction
Spectral analysis is an important method in the natural sciences. Spectroscopy is commonly used to examine an object's physical structure and chemical composition. Imaging spectroscopy combines spectral techniques with imaging to merge spectral resolution and spatial resolution, enabling area-based spectral analysis across a scene. This approach underlies multispectral and hyperspectral imaging.
What is a spectrum?
Spectrum
A spectrum is the result of polychromatic light being dispersed by an element such as a prism or grating into constituent monochromatic components. Through an imaging system these components are projected onto a detector and form a pattern arranged by wavelength or frequency, referred to as an optical spectrum.
Spectrometers for marine optics are designed and manufactured based on this principle.
Light is named according to wavelength: wavelengths between 380 and 780 nm are visible light; wavelengths shorter than 380 nm are ultraviolet; wavelengths longer than 780 nm are infrared (which can be subdivided into near-, mid-, and far-infrared).
Multispectral technology
Multispectral
Multispectral refers to the ability to acquire multiple optical spectral bands simultaneously (commonly three or more), extending beyond visible light into infrared and ultraviolet ranges. Typical implementations use combinations of filters or dispersive elements with multiple photosensitive layers or detectors, so that at the same time the system receives radiation or reflected light from the same target within different narrow spectral band ranges, producing images of the target in several different spectral bands.
The most familiar multispectral images are color camera photos, which contain red, green, and blue spectral band information. By adding additional bands to the camera or detector, a multispectral image with more channels can be obtained.
Multispectral information can be presented in image form when combined with appropriate imaging hardware.
It is also possible to use only a detector to capture spectral information for a single spatial point. The Pixelteq product line, using on-chip filter technology, can capture eight spectral channels on a 9x9 mm chip, which is useful for applications with very tight space and cost constraints.
Hyperspectral imaging
Hyperspectral
Hyperspectral imaging captures and analyzes spectra at every spatial location across an area. Because it can detect distinct spectral "signatures" at different spatial positions of a single object, it can discriminate materials that are indistinguishable by vision alone.
Hyperspectral images are composed of narrower bands (typically 10–20 nm). A hyperspectral image may contain hundreds or thousands of bands. When light from an object interacts with an illumination source and is received by a non-imaging spectrometer, the instrument can precisely report intensity differences across the spectral bands, i.e., the spectral information. In contrast, a hyperspectral imaging system provides spatially resolved spectra: each pixel has its own spectrum composed of many spectral bands. This "full-spectrum" capability gives a scene both spatial and high-resolution spectral detail.
For example, human vision detects energy in three bands: red, green, and blue. These three channels produce a wide range of perceived colors, but they cannot always distinguish a pure yellow from a mixture of red and green; this phenomenon is called metamerism. Hyperspectral imaging can readily distinguish such differences based on spectral signatures.
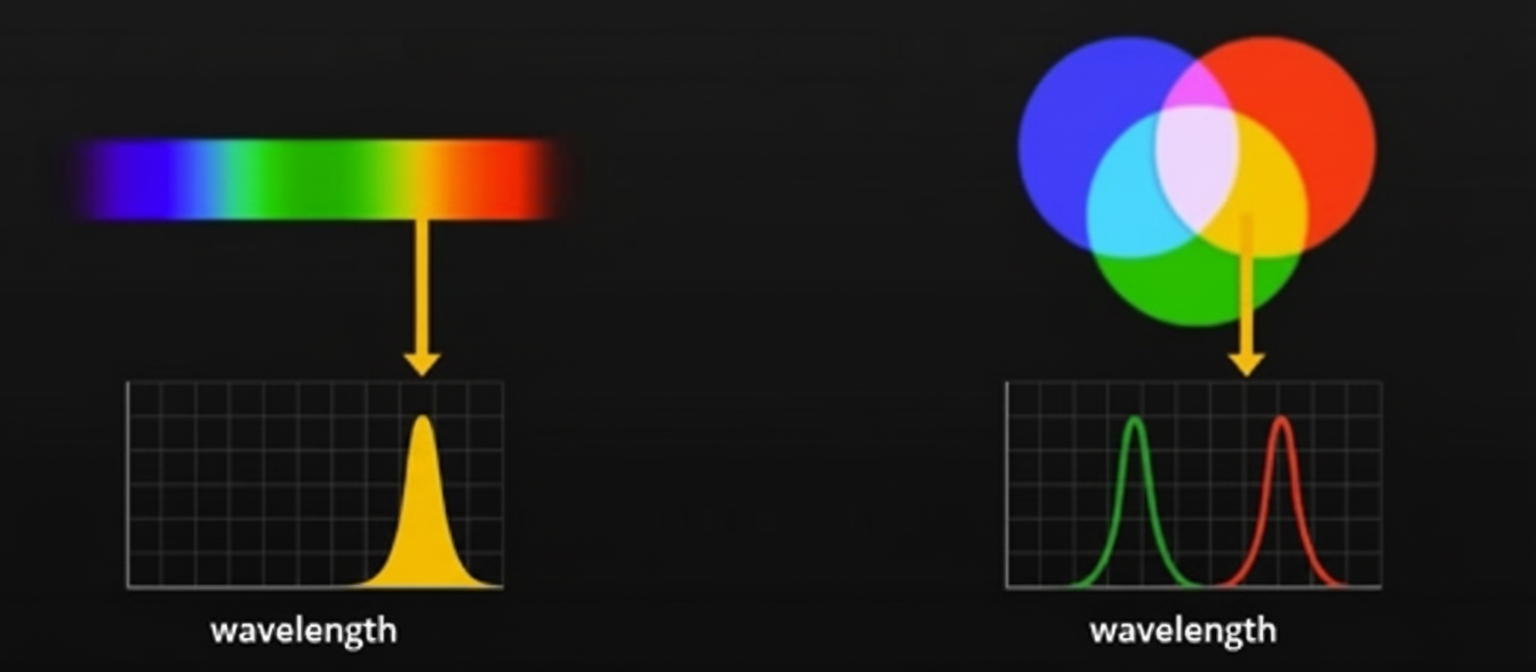
The two yellows shown above may be visually identical, but they have different spectra and can be separated by spectroscopic equipment. A non-imaging spectrometer returns an average spectrum for the entire illuminated area, while a multispectral system provides information at several selected bands across the area. Neither provides the fine-grained spatial-spectral detail that hyperspectral systems deliver.
An HSI system can be thought of as hundreds or thousands of point spectrometers arranged to cover an area, each acquiring spectra independently for its location. HSI output is an image or video stream where every pixel contains a spectrum spanning many bands. This rich data enables applications across art authentication, crop health, coastal mapping, forestry, mineral exploration, urban and industrial infrastructure inspection, production-line quality control, and environmental monitoring.
Hyperspectral scanning and imaging methods
The illustration above shows a line-scan acquisition: λ represents wavelength, x and y represent spatial pixel positions, and t is acquisition time. The diagram below shows the slit image at the focal plane array (FPA) and the resulting dispersed spectral information on the focal plane.
Differences between hyperspectral and multispectral
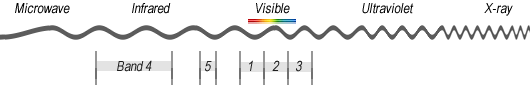
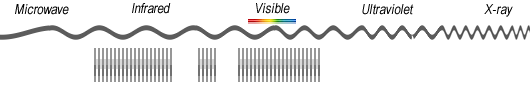
Material reflectance spectra can vary in complex ways with wavelength. Small spectral features may be unresolved by relatively coarse multispectral imaging, but resolved by hyperspectral imaging due to its finer spectral resolution and greater number of bands.
In the example above, a substance that multispectral imaging cannot distinguish (left) becomes separable with hyperspectral imaging (right) because hyperspectral systems capture many more spectral bands, allowing extraction of more detailed spectral fingerprints.
Typical applications
Hyperspectral systems can detect inks or dyes that are invisible to the eye in specific infrared bands. Compared with multispectral systems, a 60- or 300-band HSI system provides richer reflectance spectra for more precise material characterization. The image below shows a laboratory example in which a fresh piece of animal tissue on a conveyor belt was imaged with a hyperspectral camera to obtain both image and spectral data.
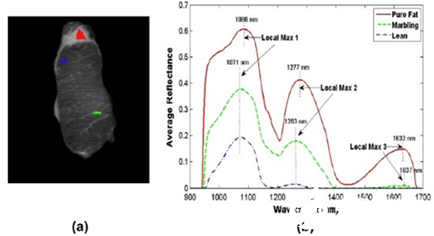
Spectral plots for different regions: (a) shows labeled regions corresponding to pure fat, marbling, and pure lean tissue; (b) shows spectra of the labeled regions in (a).
Software tools can perform imaging analysis, classification, and visualization for materials with unique spectral features. Whether data are collected from airborne, ground-based, or laboratory platforms, the processed images reveal details that may be invisible to the eye.