This article is excerpted from Detecting, Troubleshooting, and Preventing Congestion in Storage Networks.
Microburst Detection
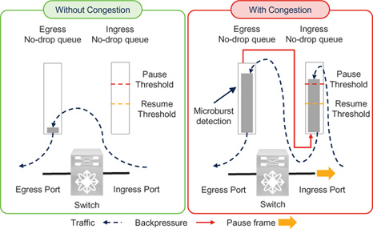
Cisco Nexus 9000 switches can detect traffic microbursts on the order of microseconds. This capability captures events that may cause short-duration congestion not visible to coarser polling intervals.
The Nexus 9000 reports a microburst when egress queue utilization exceeds a configured rise threshold and reports the end of the microburst when utilization falls below a configured fall threshold. At the time of writing, the minimum microburst granularity for some switch models is 0.64 microseconds and the minimum duration is 73 microseconds.
It is important to note that microburst detection is reported on the egress queues of the Nexus 9000 switch. As explained earlier in the ingress and egress queues section, transmission of pause frames depends on ingress queue utilization. Ingress queues fill only after the corresponding egress queues reach a level of occupancy. Therefore, microburst detection is an indicator of egress congestion. Because egress congestion can lead to ingress congestion, microburst detection may also serve as an early sign of ingress queue pressure. In other words, it can be an early signal that the switch ingress port may send pause frames.
See Chapter 8, Queue Depth Monitoring and Microburst Detection, for additional details.
PFC Storm
The term PFC storm is often used to describe congestion in lossless Ethernet networks carrying RoCE or RoCEv2 traffic, whether shared or dedicated. It commonly refers to a situation where a port sends many pause frames to slow or stop traffic, which can appear on neighboring devices as a storm of PFC pause frames.
However, the term can be misleading because "storm" implies a large number of pause frames and may not accurately reflect congestion severity. The number of pause frames does not directly indicate how severely traffic was impacted. The effect of pause frames depends on link speed, the pause quanta values, and the pattern of those frames.
Link Speed and PFC Storm
Actual pause duration depends on link speed. For example, if a 10 GbE port receives 3,000 pause frames per second with each frame using the maximum quanta of 65535 (pause time 3.355 ms), transmission can be completely stopped. A 100 GbE port receiving 6,000 pause frames per second with the same quanta will not necessarily stop transmission, because a 100 GbE link requires many more pause frames per second to fully halt traffic. In this example, the PFC frame count looks higher on the 100 GbE link, but the congestion impact may be greater on the 10 GbE link. Therefore, when using pause-frame counts to detect congestion, only compare links operating at the same speed.
Pause Time and PFC Storm
Ports that receive fewer pause frames with larger quanta values can be more affected than ports that receive many pause frames with small quanta. Many implementations use the maximum quanta value 65535, which reduces the practical significance of this point, but you should verify how your products implement pause quanta in your environment.
Reason for Pause Frames and PFC Storm
Using "PFC storm" does not explain the root cause of congestion. As explained in the lossless fabric congestion section, both slow drains and oversubscription can cause devices upstream to send pause frames.
Pattern and Content of Pause Frames
Among all factors, the pattern of received pause frames has the greatest practical effect on data transfer, followed by the state of the transmitter when pause frames arrive. Consider these two aspects.
1) Pattern and content of pause frames: It is incorrect to assume that receiving a non-zero quanta pause frame will pause traffic for exactly the quanta duration. A non-zero quanta pause can be quickly followed by an unpause frame (zero quanta). For example, if 3,000 pause frames arrive in one second, are they all maximum quanta? If half are maximum and half are zero, the effective paused time differs greatly. If all 3,000 frames have maximum quanta, a 10 GbE link might stop for a full second. If half are zero and are sent 1 microsecond after a maximum-quanta frame, the total paused time may be only 1,500 microseconds in that second. Thus, counting pause frames alone does not fully describe the actual impact.
2) State of the transmitter: The time traffic is "potentially" paused is the interval between a pause and the subsequent unpause. This is "potentially", not "definitively", because there is a slight delay before the transmitter actually stops: the port does not interrupt a frame already being transmitted. This delay depends on link speed, frame size, and when the pause frame is received. For example, if a 10 GbE port receives a pause while transmitting the last bit of a 1500-byte frame, transmission stops almost immediately. If it receives a pause just before starting a 1500-byte frame, transmission will not stop until the next 1.2 microseconds (1500x8 bits / 10 Gbps) have elapsed. If an Un-Pause frame arrives during this interval, the port may not stop at all. If such a sequence repeats every 1.2 microseconds within a second, the port could report about (1 second / 1.2 microsecond) x 2 ≈ 1.6 million pause frames while continuing to transmit at full rate. Based solely on pause-frame counts, one link could be labeled as experiencing a PFC storm while its actual behavior differs substantially from another link where 3,000 pause frames do stop transmission for a full second.
- Frame sizes used in storage traffic can be larger than 1500 bytes, for example around 2300 bytes for FCoE or even 4 KB for RoCEv2, which increases the transmitter delay before stopping. For a 10 GbE link, 2300-byte frames correspond to 2.3 microseconds delay, and 4 KB frames to about 4.2 microseconds.
- Pause frames are 64 bytes; multiple pause frames may be received while a data frame is in flight.
- Because of these factors, computing a TxWait value from pause quanta or from the timing between pause and unpause frames is inaccurate. A correct TxWait must measure how long transmission actually stopped.
The "pause frame count" in Ethernet is analogous to the "B2B credit transition to zero" counter in Fibre Channel. In Fibre Channel, the counter may increment even though transmission did not actually stop. Both counters are therefore weak congestion indicators. Avoid equating pause-frame counts with congestion severity alone, and be cautious with terms like PFC storm because they can mislead into thinking pause-frame counts are the definitive metric.
This text uses TxWait and RxWait to represent the actual time transmission is stopped in a lossless network, whether Fibre Channel or lossless Ethernet. The PFC storm term can be appropriate in environments where cumulative pause time is not available and pause-frame count is the primary metric. However, as devices improve and expose pause-time metrics (TxWait and RxWait), the PFC storm label becomes more misleading. For example, a 10 GbE port could show 100% TxWait with only 3,000 pause frames per second, while a 100 GbE port might show 10% TxWait with 6,000 pause frames per second. The latter might look like a worse "storm" based on frame counts, but the 10 GbE port actually experiences more severe congestion.
The intent is to apply lessons learned from one transport type to another. Using "PFC storm" in Ethernet mirrors an outdated practice in Fibre Channel of using "credit transition storm" to indicate congestion. When TxWait was not available, "B2B transition to zero" was the only practical indicator. Since TxWait exists, it has become the preferred metric, and "B2B transition to zero" is used only when necessary. Similarly, using "PFC storm" today implies Ethernet has not adopted the more precise metrics that Fibre Channel now uses.
Note that some vendors, including Cisco, still use the term PFC storm in their tooling. Readers should judge whether that terminology is appropriate for their environment.
Storage I/O Performance Monitoring
Traffic in a storage network is a direct result of application-initiated read or write I/O operations. Analyzing application I/O profiles — such as operation timing, size, type, and rate — helps explain traffic patterns and the causes of congestion.
Chapter 5 explains how storage I/O performance monitoring can be used to address congestion. Because the higher-level concepts (CSI and NVMe) are the same, the same concepts also apply to FCoE and RoCE, aside from transport differences. Before continuing, review the following sections in Chapter 5:
- "Why monitor storage I/O performance?" which describes the value of monitoring storage I/O.
- "How and where to monitor storage I/O performance" which covers monitoring locations: host, storage array, or network.
- "Cisco SAN Analytics" which explains how Cisco MDS switches monitor storage I/O on Fibre Channel ports inside the switch. This helps explain why Ethernet switches do not offer exactly the same capability.
- "Understanding I/O traffic in storage networks" which highlights differences between I/O traffic in Fibre Channel fabrics and in lossless Ethernet, and discusses I/O traffic vs I/O operations.
- "I/O traffic metrics" which describes metrics for monitoring I/O performance such as completion time, IOPS, throughput, and I/O size.
After reviewing those, note the following levels at which a lossless Ethernet network can be monitored:
- Port or traffic class: Most endpoints and switches report counters per network port or interface such as packets and bytes in/out. Lossless traffic classes can be monitored separately where supported.
- UDP flows: Transport layer (L4) flows are identified by the five-tuple: source IP, destination IP, source port, destination port, and the L4 protocol (TCP, UDP, etc.). RoCEv2 traffic can be classified as UDP flows. Counters such as packets, bytes, and drops per UDP flow can be monitored depending on device capabilities.
- I/O flows: An I/O flow is storage-aware and corresponds to SCSI or NVMe I/O operations on a storage volume (logical unit or namespace). Monitoring at the I/O flow level enables calculation of I/O completion time, throughput, IOPS, type (read or write), I/O size, and so on.
UDP Flow Monitoring versus I/O Flow Monitoring
UDP flow monitoring should not be confused with I/O flow monitoring for several reasons:
- UDP is a transport-layer (L4) protocol and does not understand higher-level storage semantics such as DMA, SCSI, or NVMe.
- Many I/O operations can be transported within a single UDP data stream; those operations may belong to different I/O flows.
- UDP flow metrics such as packets per second and throughput are different from I/O flow metrics such as IOPS, I/O throughput, completion time, and I/O size.
Unavailability of I/O Flow Monitoring in Lossless Ethernet Networks
At the time of writing, lossless Ethernet networks do not provide I/O flow performance monitoring inside Ethernet switches. Ethernet switches can report network latency, typically the time packets spend in the network, but this is not I/O completion time. They can also report UDP throughput, but that is not the same as read or write I/O throughput or IOPS.
Knowing only IP addresses for initiator and target does not provide useful I/O-level insight without I/O flow metrics.
It is unlikely that Ethernet switches will evolve to provide I/O-level monitoring equivalent to the SAN Analytics available on Cisco MDS Fibre Channel ports. Ethernet carries thousands of upper-layer protocols with various TCP and UDP port numbers, and enhancing Ethernet switches to decode storage protocols such as FCoE or RoCE and measure their I/O performance would likely be cost-prohibitive. Fibre Channel devices face a different tradeoff because Fibre Channel is purpose-built for storage traffic.
Alternative Approaches
An alternative is to monitor storage I/O performance on the host or storage array. Chapter 5 provides details on these approaches and how to use I/O metrics to troubleshoot congestion. Although Chapter 5 focuses on Fibre Channel, the concepts apply to lossless Ethernet.
Some Ethernet switches, such as Cisco Nexus 9000, can monitor UDP flow performance. As noted, UDP flow metrics do not equate to I/O flow metrics. Therefore, combine host and storage-array I/O performance monitoring with UDP flow monitoring on switches. RoCEv2 targets/controllers use UDP destination port 4791, and NVMe/RoCE uses UDP port 4420. By correlating information from these sources it is possible to build an effective solution.
FCoE I/O Operations
SCSI and NVMe I/O operations in an FCoE network are the same as in a Fibre Channel fabric. SAN Analytics works only on MDS Fibre Channel ports; however, if traffic passes through an MDS Fibre Channel port with analytics at any point along the end-to-end path, that port can inspect traffic and collect I/O metrics. For example, Cisco UCS servers use FCoE internally and that traffic can be observed by an MDS port to collect I/O flow metrics.
RoCE I/O Operations
Figure 7-11 illustrates an NVMe over RoCE read I/O. The host initiates a read by sending an RDMA_SEND with the command. The target sends data back to the host using RDMA_WRITE in one or more packets based on the I/O size and MTU. The I/O completes when the target sends the response packet.
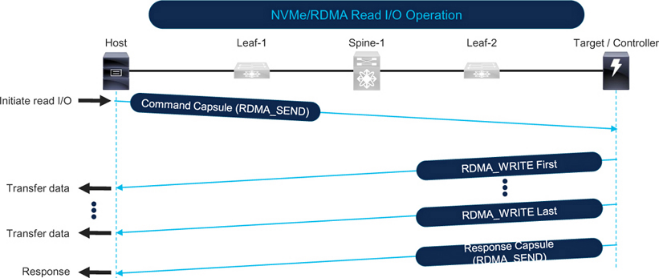
Figure 7-12 shows an NVMe over RoCE write I/O. The host initiates the write by sending an RDMA_SEND command to the target. The target issues an RDMA_READ request to the host. The host responds with RDMA_READ response packets that carry the data, split according to I/O size and MTU. The I/O completes when the target sends the final response packet.
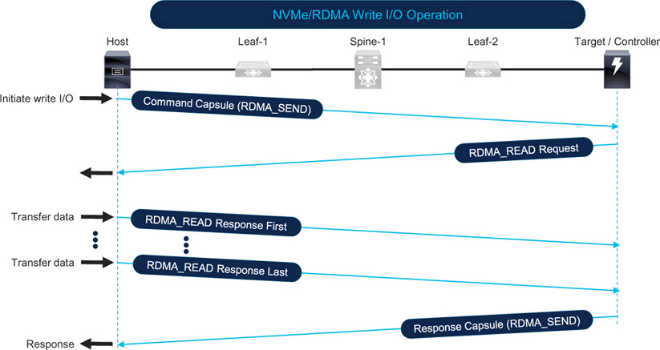
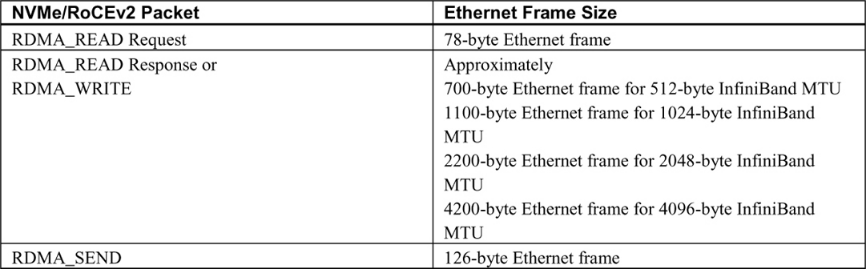
Table 7-2 shows typical Ethernet frame sizes and directions based on the type of RDMA operation.
Correlating I/O Operations, Traffic Patterns, and Network Congestion
Compare the I/O operations and traffic patterns discussed in Chapter 5 with the earlier sections on network traffic patterns and you will find strong similarities. Correlations with network congestion are also similar. For reads, SCSI and NVMe use read commands while RDMA uses RDMA_WRITE for the data path; for writes, SCSI and NVMe use write commands while RDMA uses RDMA_READ for data transfer.
See Chapter 5 sections "Network traffic direction" and "Correlation between I/O operations, traffic patterns, and network congestion" for details. The main causes of host-link congestion are multiple concurrent large read I/O operations originating from the host, while storage-side link congestion is driven by the total amount of data requested by the array.
Detecting Congestion on a Remote Monitoring Platform
Remote monitoring platforms can monitor all ports in a network concurrently to provide a single-pane view.
See Chapter 3, "Detecting congestion on a remote monitoring platform," for how to use applications such as vendor-supplied tools like Cisco Nexus Dashboard Fabric Controller (NDFC) and Nexus Dashboard Insights, or third-party and custom applications such as MDS Traffic Monitor (MTM).
This section briefly summarizes how Cisco Nexus Dashboard Insights detects Ethernet congestion. For custom applications and troubleshooting tools, see Chapter 9, which explains using the UCS Traffic Monitoring application (UTM).
Chapter 3 also discusses "pitfalls of monitoring network traffic," including the differences between average utilization and peak utilization, which are relevant to lossless Ethernet.
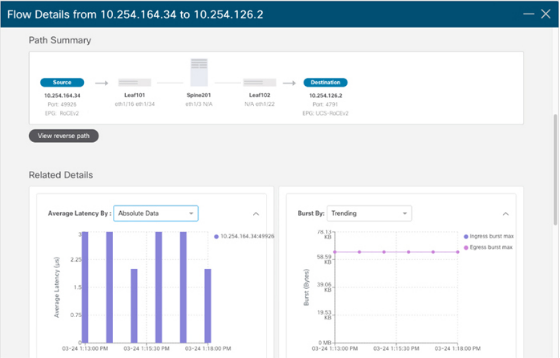
Congestion Detection using Cisco Nexus Dashboard Insights
Cisco Nexus Dashboard Insights ingests low-granularity metrics at 1-second intervals from switches and compute nodes. It uses baselining, correlation, and predictive algorithms to analyze raw metrics and reveal traffic patterns. For congestion detection, Nexus Dashboard Insights can identify data-plane anomalies such as packet loss, latency, and microbursts, and it displays end-to-end packet paths and contributing causes in a graphical interface.
Metric Export Mechanisms
Metric export mechanisms are an important consideration for custom applications or scripts. Much of the content in Chapter 3, "Metric export mechanisms," applies to lossless Ethernet.
Pay particular attention to the metric output guidance in Chapter 3. Historically, CLI output and SNMP were common, but APIs have become the norm. For large-scale, low-granularity metric export, streaming telemetry is the best option and is rapidly being adopted. Cisco Nexus Dashboard Fabric Controller and Nexus Dashboard Insights choose the best export mechanisms by default.
The following subsections summarize metric export mechanisms available on Cisco Nexus 9000 switches and do not repeat the full Chapter 3 discussion.
SNMP
Table 7-3 lists SNMP MIBs for detecting port congestion when LLFC and PFC are enabled.
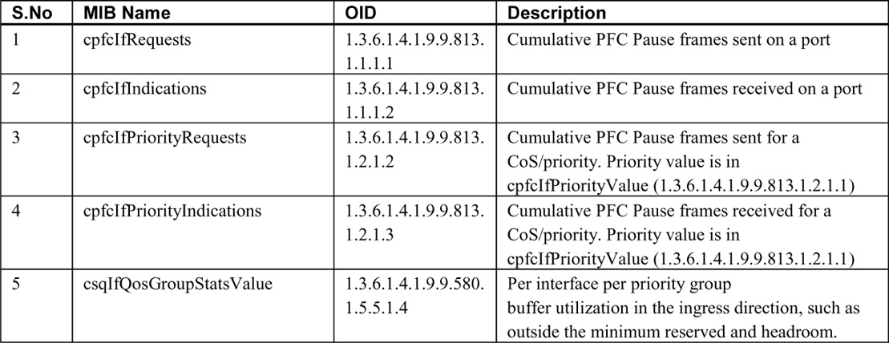
Note the following:
- PFC counters on Nexus 9000 can be monitored via the CISCO-PFC-EXT-MIB, which includes counters such as TxWait and RxWait on devices that support those metrics. At the time of writing, some Nexus models did not support TxWait and RxWait, so the MIB objects may not change even though the device responds to queries. If the device type supports CISCO-PFC-EXT-MIB, it can also be used to monitor a PFC watchdog.
- Over the years, LLFC and PFC MIB counters on Cisco devices have been affected by firmware and model-specific issues in some releases. Validate that SNMP values match CLI output before relying on them. A returned value of 0 is not sufficient validation because 0 can be a valid value that does not increment, which would cause false negatives for congestion.
- IF-MIB contains interface speed, bytes in, and bytes out and can be used to compute utilization percentages.
- Because PFC is implemented via QoS on Ethernet switches, monitoring CISCO-SWITCH-QOS-MIB can provide per-queue metrics.
Streaming Telemetry
See Chapter 3, "Streaming telemetry," for details. Additional notes for Cisco Nexus 9000:
- Nexus switches can export metrics from front-panel data ports, enabling low-granularity metric export. At the time of writing, MDS switches exported metrics only from the management port.
- Nexus supports NetFlow and sFlow, but streaming telemetry can export finer-grained metrics.
- Software telemetry on Nexus can export control-plane information and interface metrics.
- Hardware telemetry on Nexus can export metrics at granularities down to 1 second depending on switch type, including:
- Stream statistics export (SSX) for raw ASIC statistics.
- Flow table (FT) for flow-level information export.
- Flow table events (FTE) to trigger notifications when configured conditions are met.
- Nexus supports in-band network telemetry (INT) for monitoring dropped packets and congested queues.
Network telemetry and analytics are rapidly evolving. Refer to product documentation and release notes to understand capabilities and how to use them in your environment.