Introduction
PV power forecasting is a data-driven forecasting technique that analyzes historical measurements, weather forecasts, and plant parameters to predict generation output over a future time horizon. The system provides advance estimates of a plant's generation capability and supports operational planning and dispatch.
Overview of System Functions
The forecasting system typically comprises three parts: data monitoring, power forecasting, and a software platform for visualization. Monitoring provides the data foundation and includes meteorological measurements and PV plant operational telemetry. The system can perform short-term and ultra-short-term forecasts to meet different operational requirements. The software platform visualizes and analyzes monitoring and forecast results. The system is designed to conform to grid requirements and to provide accurate forecast outputs for day-ahead scheduling and operational decision making.
Software Architecture
The forecasting workflow includes the following steps.
Data Collection
The system collects real-time data from sensors and monitoring equipment, including solar irradiance, temperature, wind speed, and PV module output parameters such as power, voltage, and current.
Data Preprocessing
Collected data are cleaned, filtered, and denoised to ensure accuracy and completeness before use in models.
Model Development
Forecast models are built using techniques such as machine learning and artificial intelligence. Models may be physics-based mathematical models or data-driven statistical models derived from historical operation data.
Model Training
Preprocessed data are fed into the models and parameters are adjusted so the models can accurately predict PV plant output.
Forecast Output
After training, the system uses real-time inputs and the forecast model to generate predicted power output for the upcoming time intervals.
Evaluation and Optimization
Forecast results are evaluated, errors analyzed, and models updated to improve accuracy over time.
Basic Construction Process
Required information and data collection:
- PV plant site information: geographic area, latitude/longitude, elevation, surface features, climate characteristics, and overall layout.
- PV module details: module type, manufacturer, efficiency; tracking system or fixed tilt; inverter efficiency; recent historical operation data; and grid connection status.
- Automatic environmental monitoring station data: historical meteorological observations from monitoring stations.
System Deployment
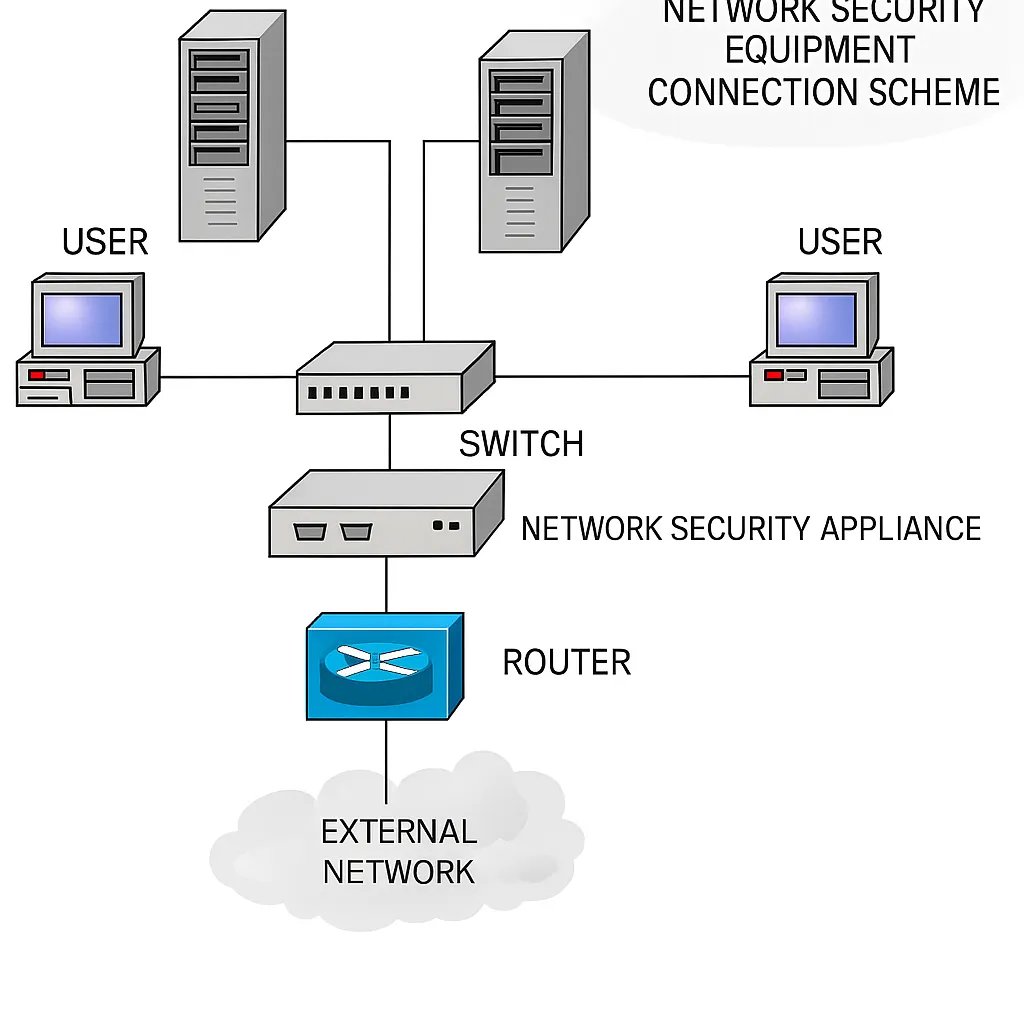
The forecasting system is often deployed on-site in a rack-mounted cabinet. The monitoring backend typically runs on a host workstation with a display for local operations and maintenance. Typical devices in the rack include a firewall, a reverse data-isolation appliance, two servers, and a network switch. Product network diagrams vary by vendor. Note that reverse isolation devices on the market include products from several manufacturers, and commissioning procedures differ. Servers commonly run Linux, with Windows also used in some deployments.
Network Isolation and Security
Network security isolation devices implement host-to-host and network-to-network isolation using specialized hardware. They sit between dispatch or control networks and public information networks to allow one-way or controlled data transfer from secure zones to less secure zones. For example, reverse-type isolation appliances can enforce unidirectional data flow from safety zone I/II to safety zone III.
StoneWall-2000 is a reverse-type network isolation appliance that provides physical isolation for data paths.
How the Forecasting System Implements Functions
- An external network server with internet access downloads the plant's weather forecast data from designated online services, typically once per day in the early morning. The forecast data are passed to the internal network via the reverse isolation appliance.
- The internal server receives plant data and environmental sensor measurements, stores them in a local database, and runs forecasting programs that read data and compute scheduling files according to required formats. Common data file suffixes include PDV. Generated files are transmitted to the dispatch center using the 102 protocol or FTP.
- The host workstation and display present forecast curves and numeric data to operations personnel for monitoring and management.
Forecast Output Files
Typical files generated by the forecasting system include short-term files, ultra-short-term files, and meteorological files.
- Short-term file: Generated from the downloaded weather forecast file. Filenames often include a DQ identifier and are uploaded at least once per day. This file provides a full-day forecast curve on the backend system.
- Ultra-short-term file: Generated from real-time environmental sensor data, typically driven by irradiance measurements for PV systems. These files are usually uploaded every 15 minutes as required by dispatch, with no interruptions permitted.
- Meteorological file: Compiled from environmental sensor measurements and sent to the dispatch center, typically every 5 minutes. Additional region-specific data requirements may apply depending on local grid regulations.
Future Trends
With continued advances in artificial intelligence and big data, PV power forecasting systems are expected to become more automated and accurate. Integration with IoT and cloud computing technologies will enable more scalable forecasting applications and new operational use cases for the PV industry.