Overview
After discussing Kafka usage in enterprise applications, an important topic is fault monitoring and recovery. This article summarizes common methods and tools for monitoring Kafka clusters and outlines basic recovery practices.
Monitoring Kafka Clusters
Monitoring a Kafka cluster is essential to ensure correct operation and to optimize performance. Common methods and tools include:
JMX monitoring
Kafka exposes a JMX (Java Management Extensions) interface that can be used to monitor and manage the cluster. Administrators can use tools such as JConsole or Java Mission Control to connect to a Kafka broker's JMX port and monitor key metrics such as throughput, latency, disk usage, and number of network connections.
Third-party monitoring tools
There are many open source and commercial monitoring tools for Kafka. Well-known options include:
Prometheus: A popular open source monitoring solution for collecting and storing Kafka metrics, often paired with Grafana for visualization and alerting.
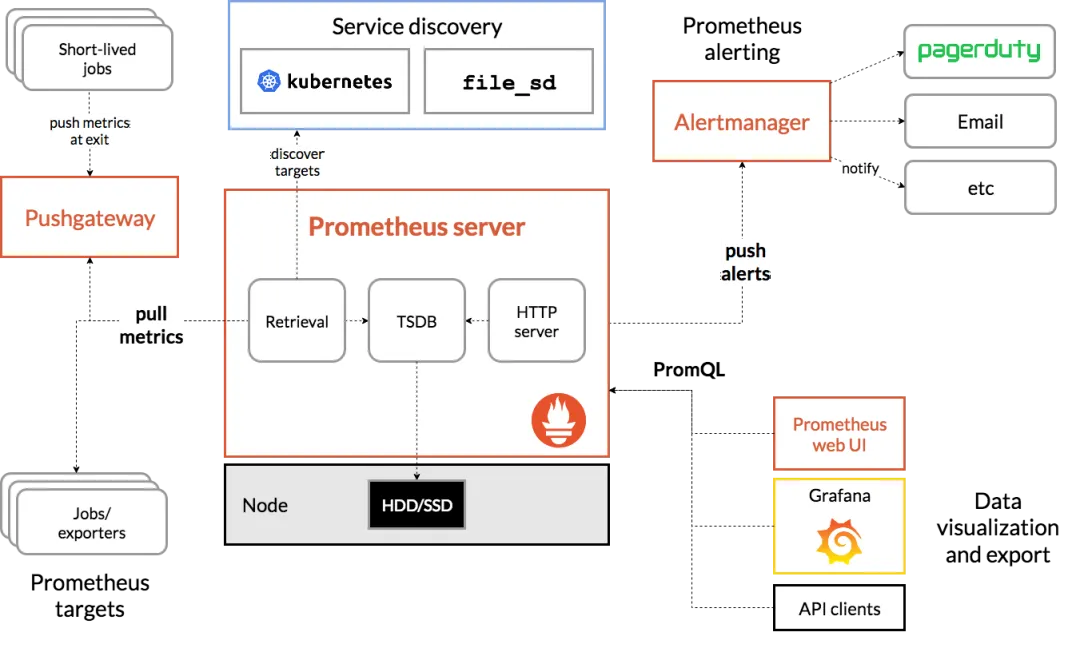
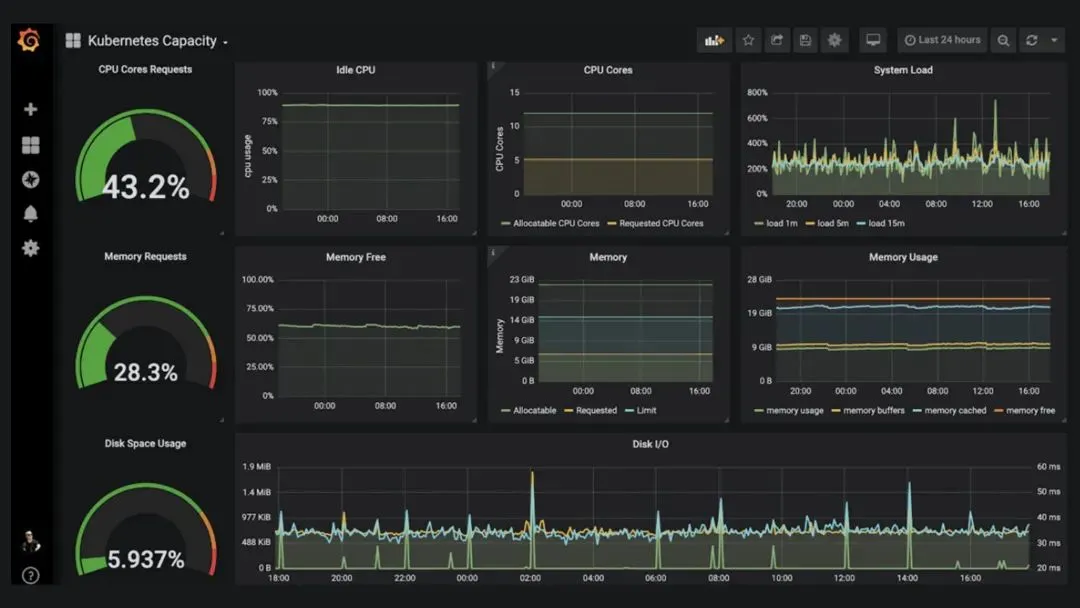
Grafana: A data visualization platform that integrates with Prometheus and other data sources to create custom Kafka monitoring dashboards.
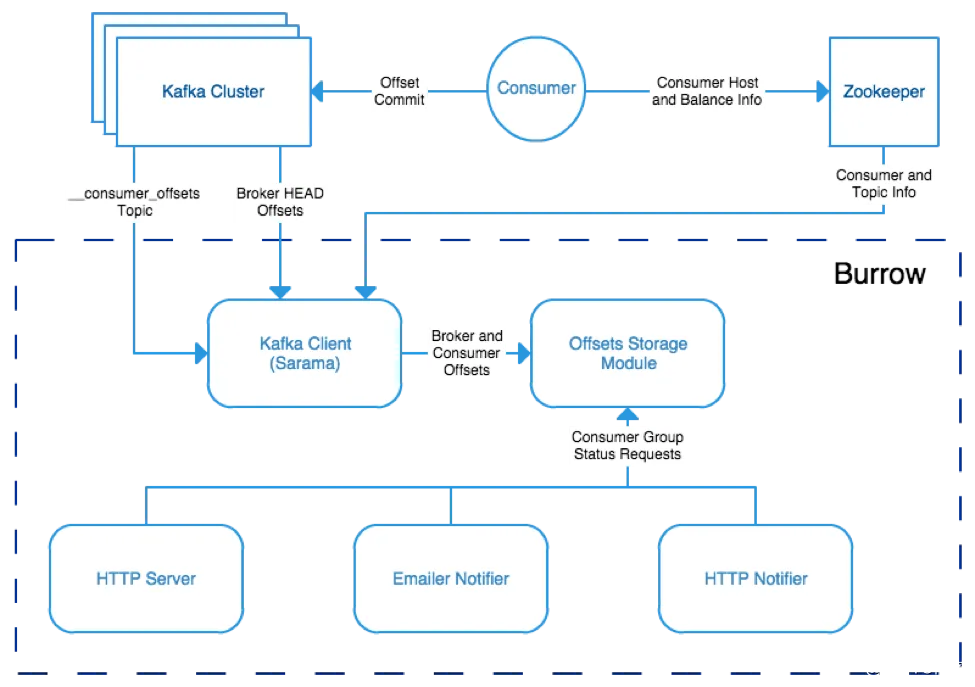
Burrow: A tool focused on monitoring Kafka consumer offsets, useful for detecting consumer lag and offset issues.
Confluent Control Center: A commercial monitoring solution from Confluent that provides centralized cluster monitoring, performance metrics, and alerting.
Custom monitoring scripts
Custom scripts can be written to monitor Kafka clusters. Using Kafka clients, administrators can implement Java or shell scripts to collect and analyze Kafka metrics, then trigger alerts or log events as needed.
Key Cluster Metrics
Tracking the following metrics helps assess cluster health and performance:
- Broker-level: throughput, latency, disk usage, number of network connections, log size.
- Topic and partition level: message backlog size, replica health, number of ISR (In-Sync Replicas), leader election counts.
- Consumer group level: consumer throughput, offset commit status, consumer lag.
Using a combination of tools and methods provides a comprehensive view of the Kafka cluster, enabling timely detection and resolution of potential issues to maintain stable, high-performance operation.
Fault Handling and Recovery
High-availability design
To improve fault tolerance, adopt the following strategies:
- Deploy multiple Kafka brokers to spread failure risk and use replication to ensure data reliability.
- Set an appropriate replication factor so each partition has a sufficient number of replicas.
- Configure a suitable ISR (In-Sync Replicas) size to ensure partition availability and data consistency.
Monitoring and error logs
Continuously monitor the cluster with monitoring tools and regularly review error logs. If errors or exceptions occur, use log information to locate and diagnose faults. Enable error logging to better track and analyze issues.
Fast failure recovery
When cluster failures occur, quick and reliable recovery is critical. Key recovery strategies include:
- Monitor leader election processes to ensure each partition has an active leader broker.
- Watch replica synchronization status and take action when the ISR set changes.
- Perform recovery steps appropriate to the failure type, for example broker failure or network partition.
Testing and drills
Regularly test and rehearse failure scenarios, especially recovery procedures. Simulate different types of failures to validate cluster availability and recovery capability, and address any identified weaknesses.
Conclusion
Kafka is a robust distributed messaging platform, but operations and fault handling require careful attention. Monitoring key metrics and implementing appropriate design and recovery practices help detect issues early and maintain stable cluster operation.