Research overview
Nonuniform current density distribution is common in proton exchange membrane (PEM) fuel cells. This study developed a highly integrated sensor with in situ signal amplification for measuring in-plane current density distribution. Sensor accuracy directly affects measurement reliability, so calibration is required before deployment. Based on a partitioned calibration test system, a single-point calibration method was used to quantitatively evaluate sensor accuracy. In a fuel cell test bench, a partition-average amplification factor derived from calibration was introduced to verify the accuracy of loop current measurements. Results show that in situ amplification effectively mitigates transmission loss and interference. Under standard operation, measurement accuracy is within 97% in the low-current range and within 98% in the non-low-current range. The work provides a practical approach for in-plane current density measurement and includes improvements in signal acquisition, structural matching, and manufacturing process compared with prior studies.
Partition calibration test system and accuracy definition
The sensor is divided into nine identical partitions, each treated as an independent loop. Due to manufacturing and component variations, each partition requires independent calibration to reduce error influence. The partition calibration test system consists of the PCB sensor, precision multimeter, power supply, drive power, data acquisition device, and LabView display. Figure 1 shows the test system block diagram. The partition preset currents match the test bench operating current range and correspond to 16 test points. During preset loop current procedures, the supply output current is finely adjusted until it reads stably on the high-precision multimeter. These preset currents are controlled and switched precisely via a single-point testing method to sequentially complete measurements for each partition at all test points.
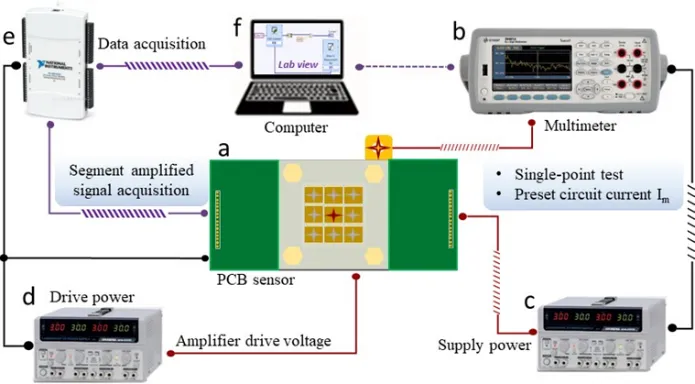
Figure 1 PCB sensor partition calibration test system block diagram
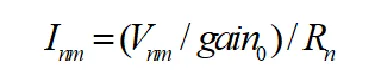
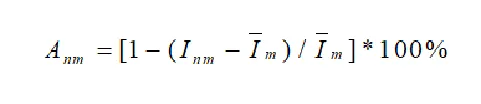
The accuracy definition includes accuracy calculation and evaluation. Using the partition-amplified voltage data acquired in calibration experiments, the relationship between voltage, current, and amplification factor in equations (1) and (2) yields partition measurement accuracy, as shown in Fig. 2(a). Across the full current test range, the low-current range exhibits larger accuracy fluctuations while the non-low-current range is relatively stable. In the low-current range (<) all partitions show some fluctuation down to 97.25%, whereas in the non-low-current range (>) partition accuracy stabilizes above 98.25%. Therefore, results from the stable non-low-current range are relatively reliable for defining partition amplification factors.
The partition-average amplification factor is influenced by the amplifier's actual gain and circuit manufacturing. It reflects amplifier performance under real conditions. For accuracy, it is necessary to use results from the stable non-low-current range when evaluating the partition-average amplification factor. The measured amplification factor deviates from the theoretical value by about 2%. Reliability was further assessed by introducing the root mean square error (RMS E). Fig. 2(c) shows the data distribution after applying the partition-average amplification factor.
The nine curves correspond to partition RMSE distributions across test points. The RMSE in the low-current range is below 3.57 mA, slightly higher than the 3.13 mA RMSE in the non-low-current range. This indicates measurement fluctuations within a 4 mA range. Using the partition-average amplification factor derived from the stable non-low-current range demonstrates RMSE stability. Thus, RMS evaluation shows the partition-average amplification factor method is reliable. Recalculating partition measurement accuracy using the average amplification factor yields an overall trend close to 100%, as shown in Fig. 2(d). Deviations in the low-current range are mainly due to inherent fluctuations there. The results are consistent with practical observations and further validate the calibration method.
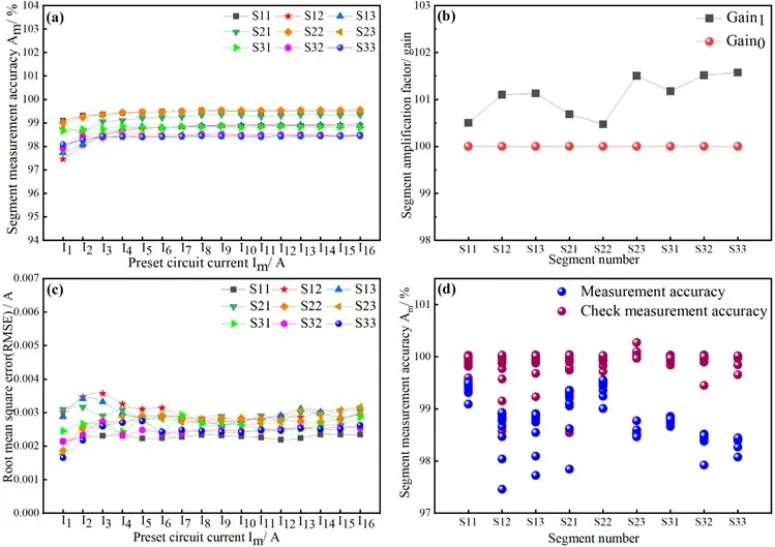
Figure 2 Definition of PCB sensor measurement accuracy: (a) partition measurement accuracy; (b) partition-average amplification factor; (c) root mean square error; (d) corrected partition measurement accuracy.
The calibration experiments evaluated and validated partition measurement accuracy. To determine the detection level in practical applications, the sensor's performance in a fuel cell test bench was used to verify accuracy during synchronous partition operation and to observe amplified in-plane current distribution under different operating conditions.
Fuel cell test bench and operating conditions
The calibration results establish partition amplification factors. Introducing these factors largely eliminates the influence of sensor measurement error on bench experiments, enabling a more accurate presentation of in-plane current distribution. In the bench test, the current entering each sensor partition is unknown, so measurement accuracy of the bench loop current is compared against the total circuit current.
The distributed in situ amplified-signal sensor test system comprises a Scribner 850e test bench, single-cell assembly, manifold, drive power, data acquisition device, and LabView display, as shown in Fig. 3. The test bench supplies gases and controls online operating parameters, including reactant supply, flow control, inlet pressure adjustment, temperature, and humidity. The single-cell assembly integrates the sensor and a dedicated cathode flow-field. The sensor, with in situ amplification, is placed between the graphite cathode plate and the current collector. The cathode current collector design allows compact nonplanar sensor mounting. A manifold enables synchronized acquisition of single-cell and partition signals by the data acquisition system.
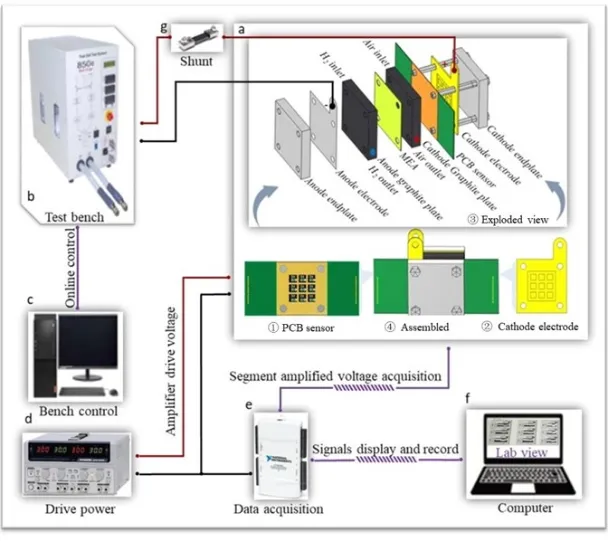
Figure 3 Distributed in situ amplified-signal sensor test bench
Bench testing adjusts load parameters under preset partition operating conditions and acquires in-plane partition-amplified voltage data. Computation yields the in-plane in situ amplified current density distribution. Table 5 lists the partition experiment operating conditions.
Accuracy verification
Bench tests record in-plane partition-amplified voltages under various load conditions. Fig. 4(a) shows larger voltage fluctuations in the inlet region and some fluctuation in the outlet region; these fluctuations increase with load current. Fig. 4(b) compares three forms of current: bench circuit current, the sum of partition currents without calibration amplification factors, and the sum of partition currents after applying calibration amplification factors. Differences exist but are small.
To clarify differences, the three circuit-current sets were normalized by the preset load current Im of the bench, as shown in Fig. 4(c). Measurement accuracy was calculated with bench current as the reference. Fig. 4(d) shows measurement accuracy with and without the amplification factor. Verification indicates accuracy within 97% in the low-current range and within 98% in the non-low-current range. Figures 7(e-f) show measurement stability under variable and dynamic operating parameters.
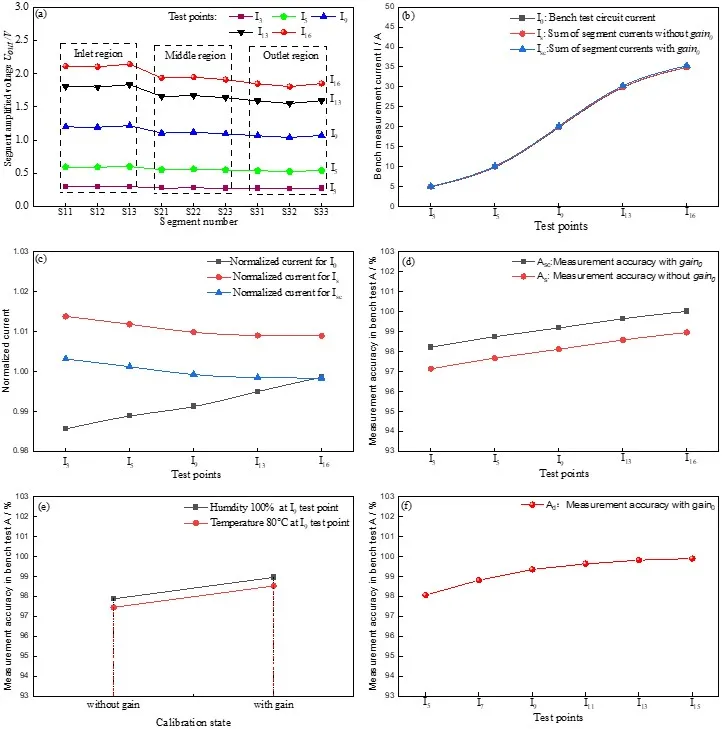
Figure 4 Bench test analysis: (a) in-plane partition-amplified voltage measurements under different loads; (b) comparison of bench circuit currents before and after applying calibration amplification factors; (c) normalized bench circuit current comparison; (d) comparison of measurement accuracy before and after applying amplification factors; (e) accuracy under variable parameter conditions; (f) accuracy under dynamic conditions.
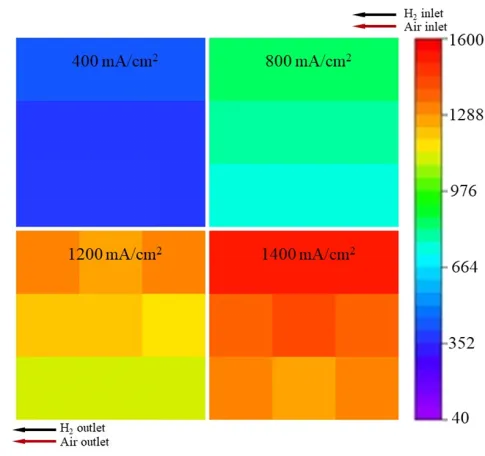
Figure 5 In-plane distributed current density under different operating conditions
Partition current density distributions under various conditions were calculated from partition voltages. Fig. 5 shows the in-plane distribution nonuniformity. Inlet current density is higher while outlet current density is lower, and their difference becomes more pronounced with increased load. Due to higher reactant concentration near the inlet, current density peaks near the inlet and generally decreases toward the outlet.
Conclusion
This article details calibration and application of a PCB sensor. Partition calibration and bench experiments defined and validated sensor measurement accuracy. Using a fuel cell test system with integrated sensors, in-plane in situ amplified current density distributions were observed under different operating conditions. Internal measurement techniques are important for performance evaluation and optimization of fuel cells. Application of single-cell PCB sensors should be extended to commercial stacks to enable optimization of operating parameters and precise control in practical deployments.