PSRR Overview
In electronic systems, power stability and the ability to suppress ripple noise are critical. The power supply rejection ratio (PSRR) describes how well a device suppresses power supply ripple. PSRR commonly appears in datasheets for amplifiers, regulators, and power management ICs. It is defined as the logarithmic ratio between input ripple and output ripple, expressed in decibels (dB).
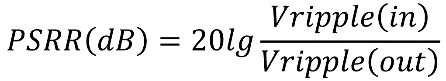
In the formula, Vripple(in) is the ripple at the input and Vripple(out) is the ripple at the output.
In most cases PSRR is calculated as 20·log10(Vripple(in)/Vripple(out)), yielding a positive value. If the inverse ratio Vripple(out)/Vripple(in) is used, the PSRR value will be negative.
PSRR Test Applications
PSRR is widely used in power management ICs (PMICs) and for evaluating the performance of regulators and amplifiers. Modern systems such as processors (GPUs, SoCs, FPGAs), high-speed serial interfaces (SerDes, PCIe, USB), and high-speed parallel memories (DDR, LPDDR, GDDR) require low-voltage, stable power rails with strong suppression of supply ripple. Ripple on power rails can originate from switching noise and harmonics, digital crosstalk, clock coupling, and other sources. If the power supply does not sufficiently suppress ripple, the system can experience jitter, bit errors, reduced stability, and lower overall efficiency.
For example, an LPDDR memory used in AI applications may operate as low as 0.5 V, leaving very little margin for supply ripple.
Because these devices require low-voltage supplies and often high throughput, a stable power source with strong ripple suppression is necessary. Insufficient ripple suppression can lead to:
- Reduced system energy efficiency due to poor power optimization.
- Data corruption or algorithm errors in chips caused by small supply ripple, affecting reliability and accuracy.
- Degraded communication or sensing performance in RF or signal-processing applications, potentially causing false detection or communication errors.
Test Method Overview
A typical measurement approach injects a swept sinusoidal disturbance into the supply and measures input and output ripple to derive the PSRR curve. Many oscilloscopes offer a PSRR application or measurement workflow that automates the acquisition, calculation, and plotting of PSRR.
A low-noise, high-resolution oscilloscope such as a Mainstream-series instrument is suitable for accurate PSRR testing. The basic connection and workflow are:
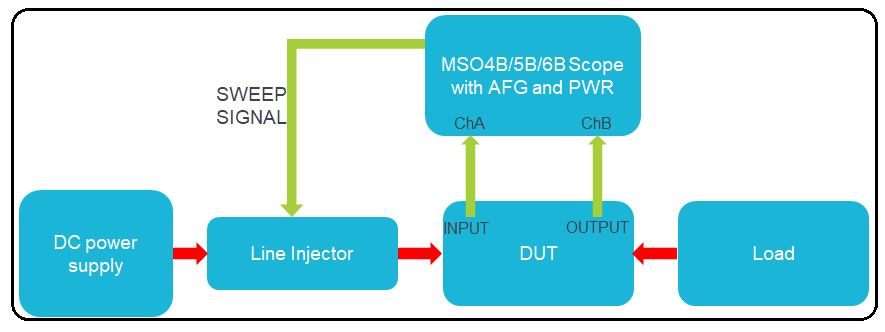
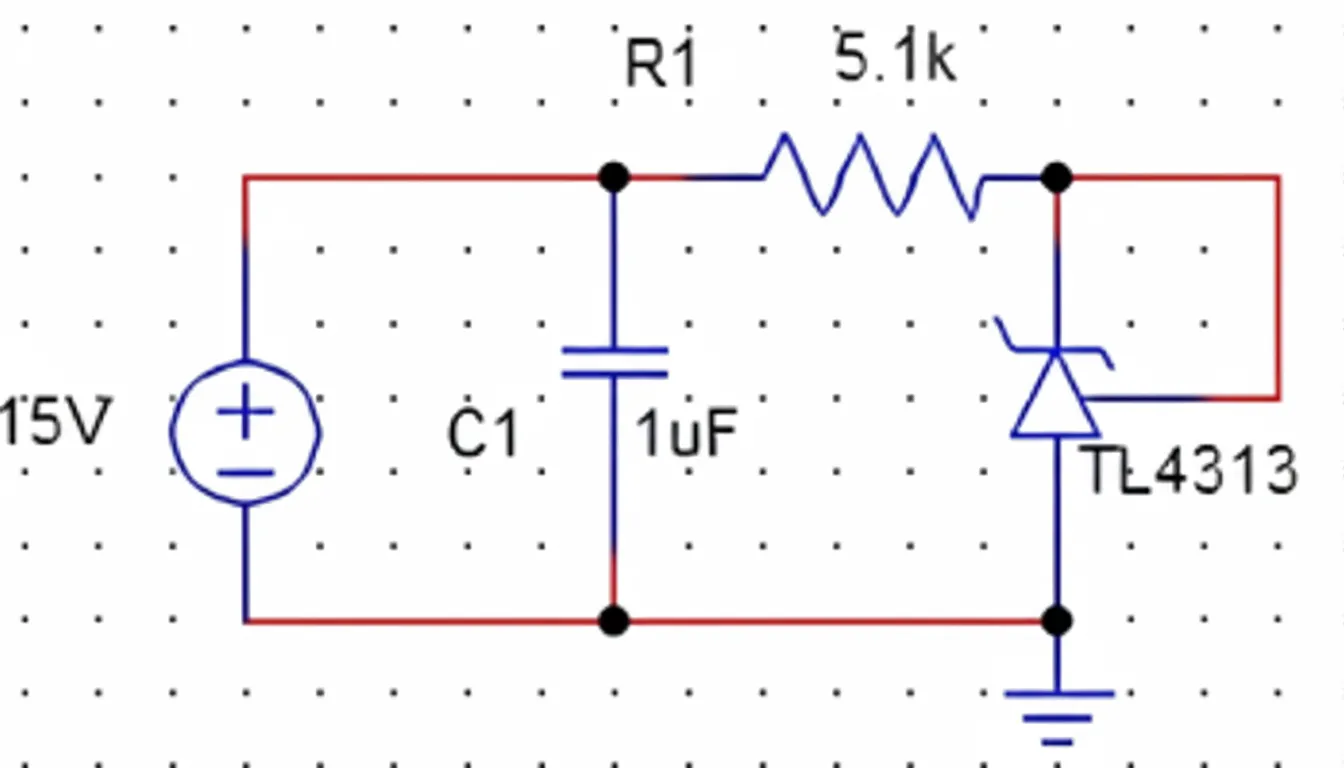
Figure 1: PSRR test connection diagram
- Use the function generator (AFG) to inject a swept-frequency signal into a linear injection module, then route that disturbance into the DUT power input.
- Measure the ripple at the DUT power input and output with the oscilloscope channels.
- Use the oscilloscope PSRR function to calculate PSRR, record data, and plot the PSRR curve.
Recommended Test Equipment
| Device | Recommended Series or Model | Notes |
|---|---|---|
| Oscilloscope | MSO6B / MSO5B / MSO4B series | With options AFG and PWR |
| Probes (two) | TPP0502 or TPR1000 | |
| Linear injection module | J2120A | Picotest |
| Auxiliary test cables | Cables for connecting the oscilloscope, linear injector, and DUT | |
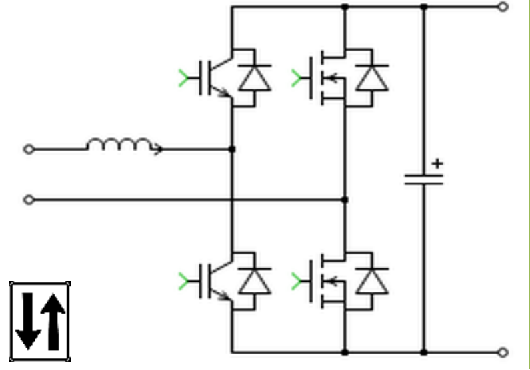
Figure 2: Recommended PSRR test configuration
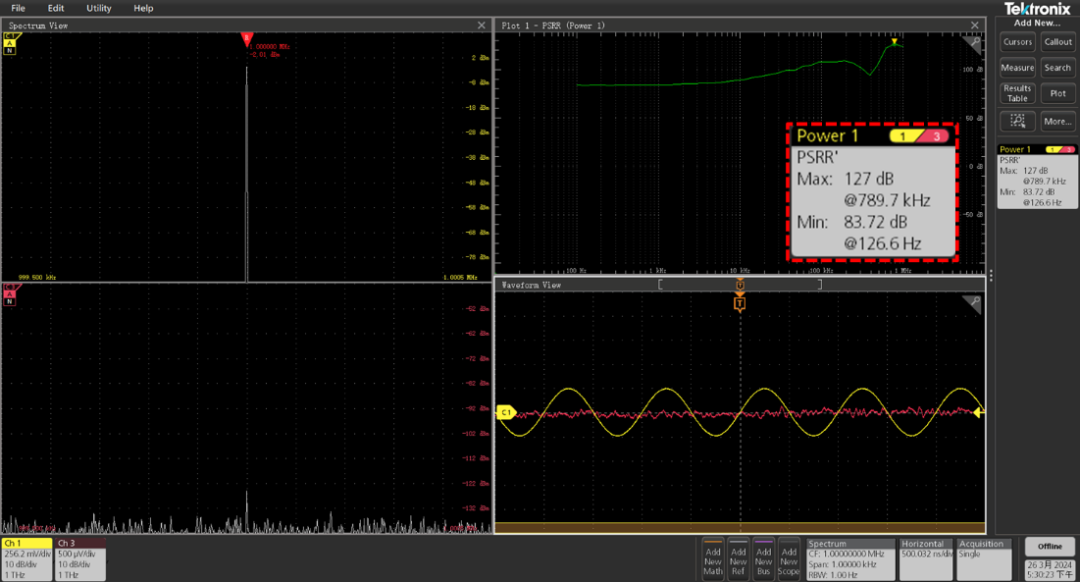
Validate the dynamic test range by injecting a 100 mV signal and sweeping frequency:
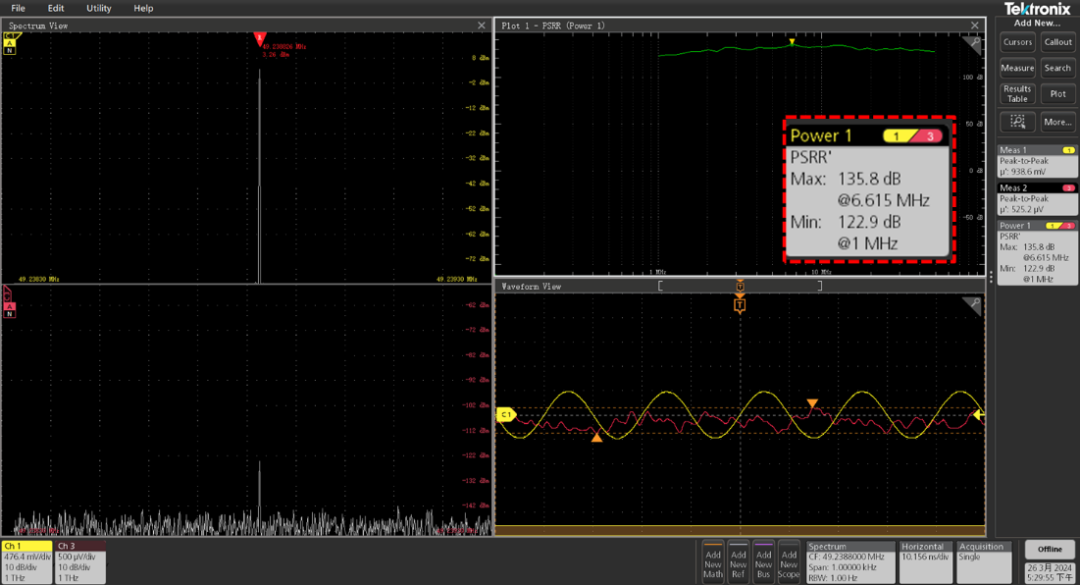
Figure 3: PSRR dynamic test range validation (injection amplitude 100 mV, frequency 100 Hz–1 MHz, device under test: 150 dB attenuator)
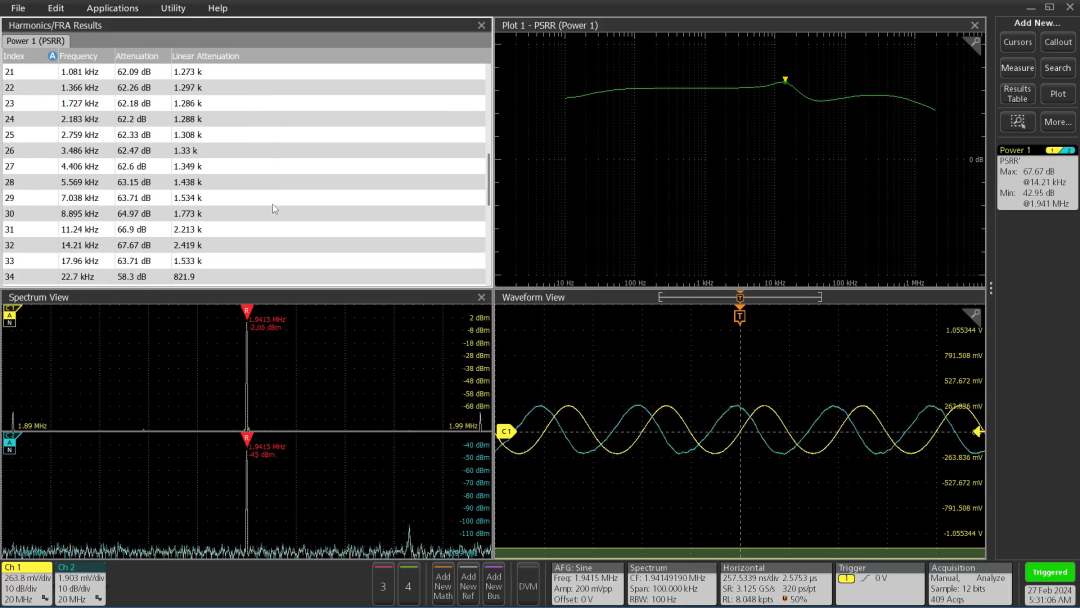
Figure 4: PSRR dynamic test range validation (injection amplitude 100 mV, frequency 1 MHz–50 MHz, device under test: 150 dB attenuator)
Figure 5: Example PSRR measurement results