Tesla's 4680 lithium-ion cell represents a notable change in electric vehicle cell design. This article summarizes a three-electrode analysis and measurements of electrical and thermal properties.
1. Three-electrode analysis
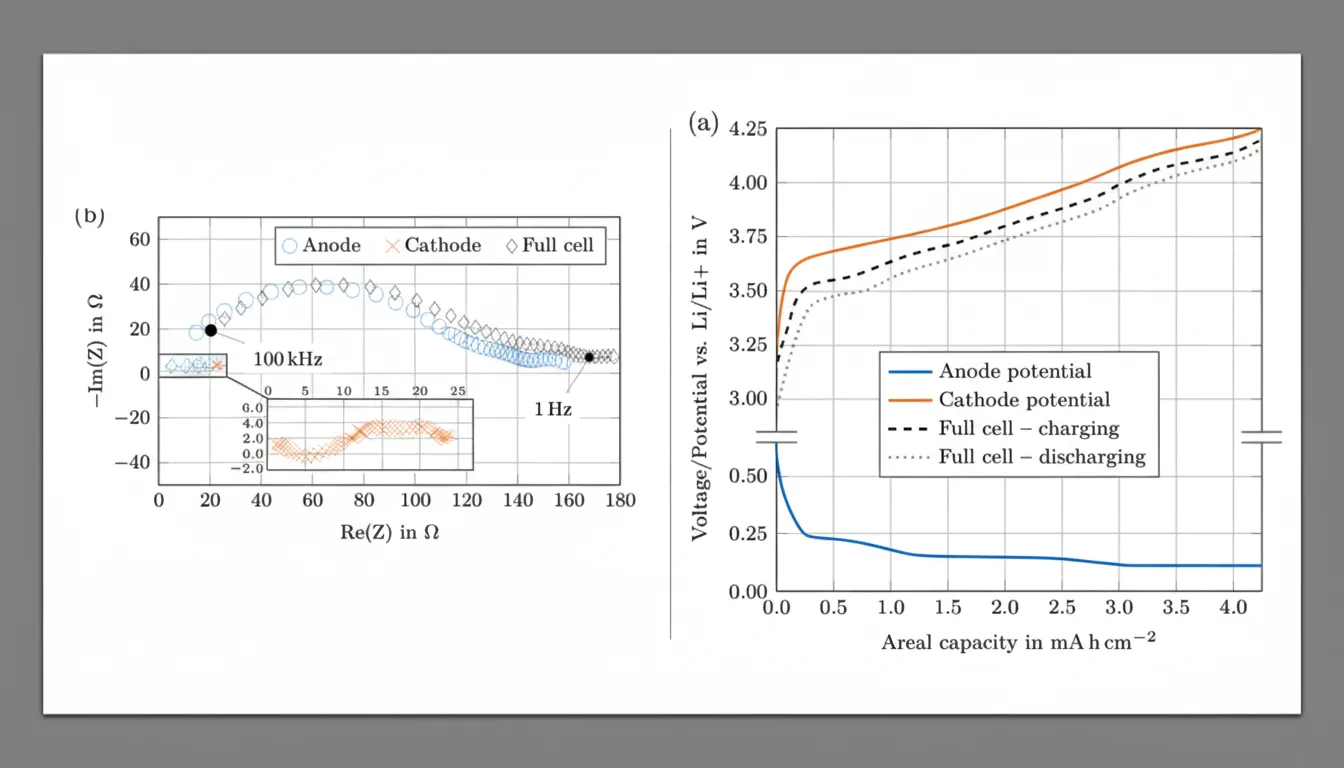
Using a three-electrode configuration, the full cell, anode, and cathode pOCV (biased open-circuit voltage) were extracted at a C/50 current. During C/50 cycling, Coulombic efficiency for all cells exceeded 99%, indicating representative results. The anode potential shows characteristic plateaued behavior during lithiation, with distinct potential stages near 0 V vs Li/Li+.
Graphite phase transitions during lithiation are apparent as three clear voltage plateaus at about 210 mV, 120 mV, and 85 mV. Measured cathode potentials display features consistent with NMC (nickel manganese cobalt) chemistry.
2. Electrical characterization
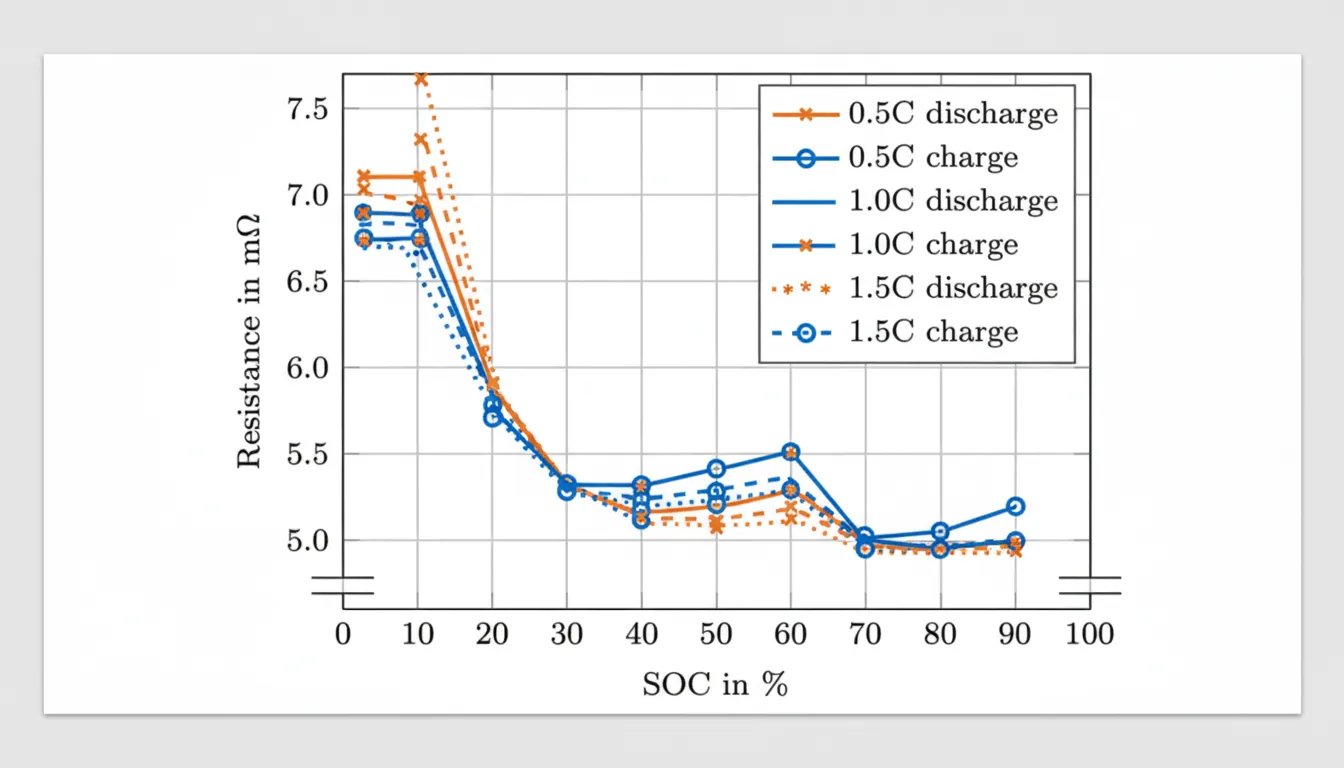
Electrical properties measured include capacity and impedance. Capacity measured at different discharge rates shows variation, while impedance spectra indicate the anode impedance is significantly higher than the cathode. This kinetic limitation may arise from material properties, degradation, or interactions from disassembly and cleaning procedures.
Resistance increases in the low SOC region and in the 50% to 70% SOC range, matching the graphite phase transitions. Dependence of resistance on C-rate is modest; resistance decreases at high currents, consistent with prior observations. However, during discharge at low SOC, resistance increases with increasing C-rate.
The influence of current on cell impedance may be driven by nonlinear behavior of the charge-transfer reactions. Cell disassembly analysis shows this effect is especially pronounced at low SOC.
3. Thermal testing
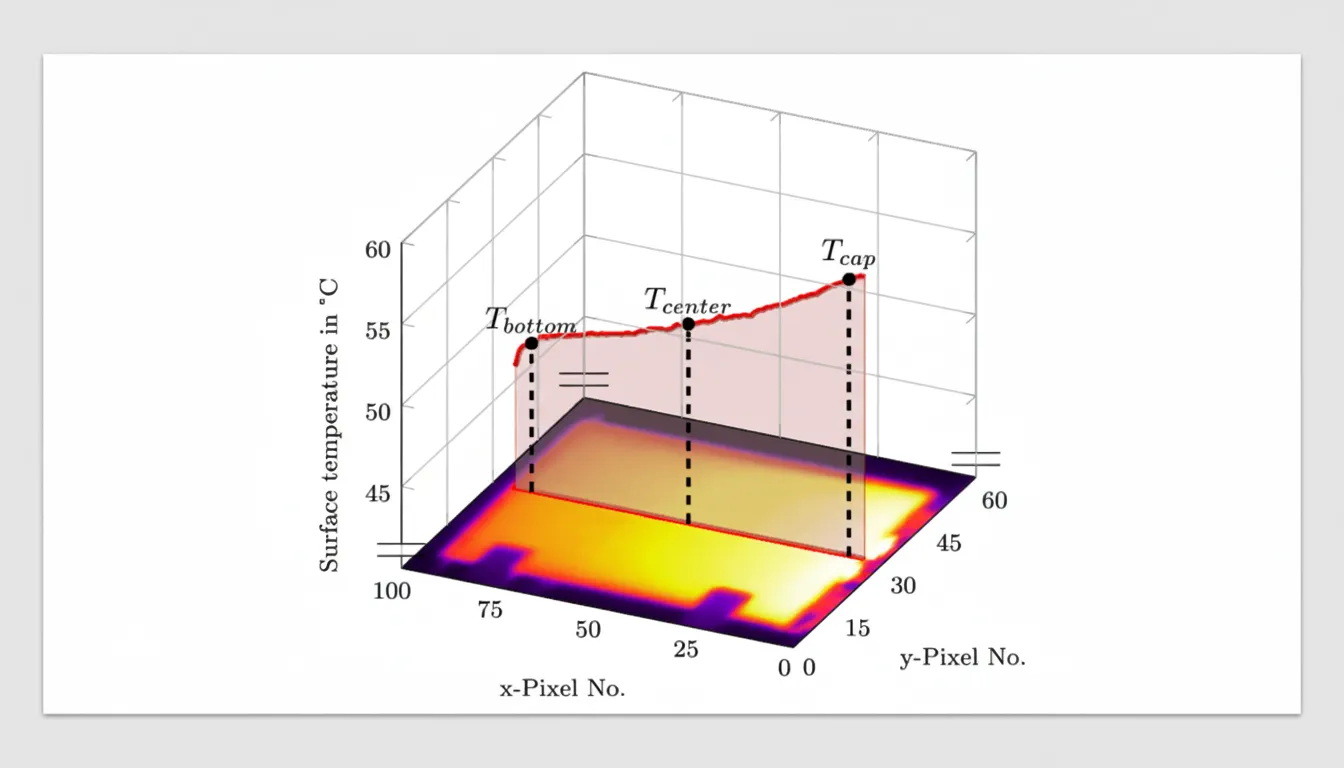
Thermal imaging was used to evaluate temperature distribution during charging. Results show that at 2C charge, the cell surface temperature averaged around 70°C, which is higher than typical lithium-ion cells.
Summary
Measured electrical and thermal characterization and three-electrode analysis indicate that the tested 4680 cells did not meet their intended design targets.