




ESP32 Health Monitor PCB: 2-Layer FR-4 DFM for Clean ECG
Key Moment
- 0:00 Introduction & Dashboard Overview
- 2:00 AIVON PCB Sponsorship
- 2:28 Components Required
- 3:18 Block Diagram
- 4:01 Schematic Design
- 4:42 PCB Layout & 3D View
- 5:08 Ordering the Custom PCB
- 5:52 Assembling the Hardware
- 6:40 Coding & Libraries
- 7:44 Uploading the Code
- 8:10 Connecting Sensors to the Body
- 9:24 Accessing the Live Web Dashboard
- 10:09 Vitals Monitor Page
- 10:49 Patient Record Page
- 11:07 Data Logging & Excel Export
- 11:34 Clinical Alerts Page
- 11:46 Outro & Resources
Project Background
A breadboard full of biomedical modules is useful for an afternoon and unreliable by dinner. That is the starting point of the How To Electronics build documented in the KOL video. The creator needed a low-cost station that could read heart rate from a real ECG waveform, SpO2 from a fingertip, body temperature from a 10K NTC, plus room temperature and humidity—then serve every reading from the ESP32 itself. Anyone on the same Wi-Fi network opens an IP address. No extra display. No cloud bill.
That brief does not survive jumper wire. Cardiac signals sit in the millivolt range. The ESP32 radio is a noisy neighbor. Electrode cables, a shared I2C bus, and an analog divider all compete for the same ground. Educational IoT health projects have exploded for the same reasons hospitals and labs care about analog discipline: engineers want a compact station they can demonstrate without holding cables still, while still treating the board as part of the instrument rather than a way to hide wires.
The market context is practical, not clinical. Universities, makerspaces, and product teams use ESP32-class boards to learn R-peak detection, local web dashboards, and multi-sensor I2C before they ever touch IEC 60601 isolation. The failure mode is familiar: a dashboard that looks complete while AIN0 is modulated by Wi-Fi bursts, a missing ACK at 0x57 that looks like a dead oximeter, or a dangling electrode that invents tachycardia. A compact 2-layer PCB with local decoupling and short analog runs is what turns the sketch into a station.
What This Video Covers
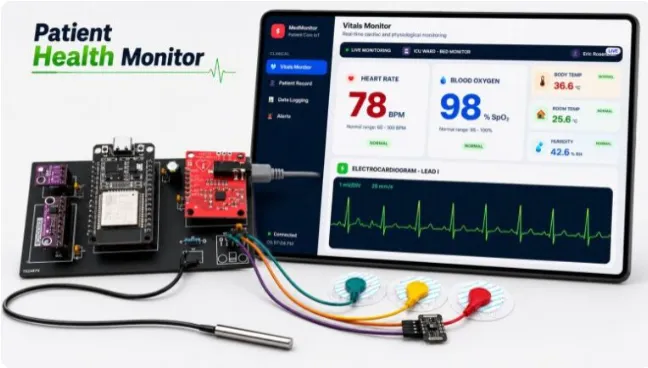
The video walks from breadboard intent to a soldered 2-layer station and a live local dashboard. It opens with the vitals UI—BPM, SpO2, ECG, body temperature, room temperature and humidity—then shows the AIVON-sponsored board, the component list, and the block diagram that splits analog cardiac work from digital optical sensing.
From there the creator covers the EasyEDA schematic and layout: ESP32 DevKit v1, AD8232 into ADS1115 AIN0, MAX30102 at 0x57, 10K/10K NTC divider into AIN1, BME280 at 0x76, SDN on GPIO 5, and LO+/LO− on GPIO 18 and 19. Gerbers go to AIVON. Boards return in days. Assembly uses female headers so modules can be swapped in an evening. Firmware prints an IP at 115200 baud, hosts the page, samples ECG near 125 Hz, and updates slower sensors every two seconds. Electrodes go on the arms and driven right leg; the MAX30102 sits on a fingertip; the NTC sits on skin. The browser shows vitals cards, alerts, patient records, interval logging, and Excel export.
The manufacturing thread is as important as the firmware thread. The video is a case study in 2-layer FR-4 that has to hold drill, mask, and outline so a 125 Hz teaching ECG can sit next to an ESP32 radio and still look like a heart.
Project Highlights and Key Features
- Sensor split that keeps the optical path off the cardiac amp. ECG stays analog on the AD8232 into ADS1115 AIN0. SpO2 stays digital on the MAX30102 so the LEDs never fight the front-end. Body temperature uses a Beta 3950 NTC divider into AIN1. Room air stays on the BME280 so a warm lab is not mistaken for a fever.
- 16-bit conversion off the ESP32 SAR ADC. Moving ECG and NTC onto the ADS1115 keeps millivolt swings off Wi-Fi jitter. Firmware finds R-peaks and draws a PQRST-style trace at about 125 Hz.
- Lead-off treated as software DFM. Red on the right arm, yellow on the left, green as driven right-leg. LO+ and LO− stop invented heartbeats: a flat cyan line and a "LEADS OFF" banner instead of fake BPM.
- Local power that matches analog reality. 10 µF bulk plus 100 nF at each IC pin. Ceramics sit on the pins, not somewhere on the 3.3 V net. Analog traces stay short and off GPIO 21/22.
- 2-layer stack-up chosen for a teaching instrument, not an HDI wearable. Standard FR-4, 1.6 mm class, 1 oz copper both sides, lead-free HASL for first articles, through-hole plus female headers. Front-side priority for the ESP32, ADS1115, connectors, and decoupling.
- Station firmware instead of a cloud bill. The ESP32 hosts vitals cards, alerts, patient records, interval logging, and Excel export. ECG samples land near 125 Hz; slower sensors update every two seconds.
- Assembly that still allows module swaps. Headers let the creator finish the board in an evening and still replace a sensor. Once the waveform was stable, the clinical UI stopped being theater.
- Fast-turn fabrication that made analog confidence visual. Gerbers left EasyEDA, landed at AIVON, and boards came back in three days—clean mask, honest holes, a double-sided panel that matched the 3D view.
Challenges Encountered During Development
ECG next to a Wi-Fi radio is a known headache. On a breadboard the electrode cable, USB ground, and ESP32 bursts all couple into AIN0. Moving conversion onto the ADS1115 is the right instinct, but three I2C devices only behave if addresses stay unique and pull-ups exist once. A missing ACK at 0x57 looks like a dead oximeter when the BME280 ADDR pin is simply wrong. Headers add inductance, which is why the 100 nF parts must sit at the module. Without LO+ and LO− in firmware, a dangling electrode becomes fake tachycardia.
The board then raises factory questions that have nothing to do with six-layer HDI. The layout is compact, through-hole heavy, and parks connectors near the outline—the same pattern that fills the engineering-query queue on 2-layer FR-4. CAM routinely holds files when via tenting on the quote disagrees with the mask layer, when reference designators sit on solderable pads, when copper pours to the routed edge, and when header holes never declare PTH or NPTH.
A recent 2-layer PCB CAM review made the mechanical risk obvious. Pad-to-pad spacing sat at 4 mil where 7–8 mil would have given a reliable solder-mask bridge. Several 3.1 mm PTH holes had no mask opening. Pads sat on the outline of a customer-built V-cut panel, and the V-cut lines were duplicated. After routing that is exposed copper and a ground the ECG firmware should not trust. Those are not exotic problems. They decide whether a first article solders and whether a 125 Hz trace can be trusted.
Cost and schedule pressure sit underneath the electrical work. The project is a learning platform, not a certified diagnostic device. Six layers were never the requirement. The requirement was 2-layer FR-4 that holds drill, mask, and outline tightly enough that firmware can trust the numbers. A ragged soldermask or an offset header hole sends a designer hunting the AD8232 for noise that started in the fab.
How AIVON PCB Helps
AIVON is built for this class of work: rapid PCB manufacturing and expert DFM on standard 2-layer FR-4, not only on HDI, rigid-flex, or high-frequency stack-ups. The Gerbers left EasyEDA and landed at AIVON. Boards came back in three days with clean mask, honest holes, and a double-sided panel that matched the 3D view. That turnaround is what keeps a teaching instrument on schedule. Analog confidence is visual. When mask, drill, and outline are honest, the designer stops blaming the front-end for factory geometry.
The same review double-sided files receive on the floor is the review this monitor needed: align via covering with the Gerber mask, pull silkscreen off pads, keep copper 0.2 mm from a routed edge and about 0.4 mm from a V-cut, and open every PTH header. On a tight-spacing panel the fix is unglamorous—spread pads to 7–8 mil, pull features 0.3–0.5 mm off the outline, open the large holes, delete the extra V-cut. After that the order released.
AIVON's value on this project is the boring details done tightly:
- Fast-turn 2-layer FR-4 prototyping with lead-free HASL suited to through-hole headers and first articles.
- CAM discipline that catches tenting mismatches, silkscreen on pads, outline copper, duplicated V-cut lines, and undeclared PTH versus NPTH.
- Local decoupling geometry that survives manufacture: 100 nF within 2–3 mm of each 3.3 V pin so ECG supply rejection is a layout fact, not a wish.
- One-stop path from prototype boards to PCBA when the next revision leaves female headers behind.
- Reliable delivery so a 125 Hz educational trace can be demonstrated on copper instead of DuPont wire.
What the PCB enabled matters more than what it "fixed." ECG_OUT no longer hops three jumper colors. The NTC divider lives on copper. Each rail has a ceramic where the current loop is small, so a 125 Hz trace can sit next to an ESP32 radio and still look like a heart. Manufacture the outline, mask, and drill tightly enough and firmware can trust the numbers. That is AIVON's job on educational analog boards and on the next prototype that actually has to leave the bench.
Conclusion
This build holds together because How To Electronics treated the PCB as part of the instrument. The ESP32 still does the clever work—web server, R-peak math, SpO2, patient log—but the board is what lets a live ECG sit next to a Wi-Fi radio without falling apart. Short AD8232 runs, ceramics on the pins, lead-off pins that the firmware actually uses, and a 2-layer file that CAM will not have to argue with are the habits that make the IP address worth opening.
The design remains a learning platform, not a certified diagnostic device. Clinical monitors need isolation, IEC 60601 thinking, and a quality system. The useful takeaway is analog and DFM discipline on standard FR-4: keep analog nets short, put 100 nF on the pins, name PTH holes, keep copper off the router, and let a three-day AIVON panel prove the waveform.
PCB-Related FAQ
Q1: Is a 2-layer PCB enough for an AD8232 ECG front-end next to ESP32 Wi-Fi?
A1: Yes for an educational single-lead monitor if analog runs stay short, each 3.3 V pin has local 100 nF within 2–3 mm, and ECG_OUT does not run parallel to GPIO 21/22. Four-layer construction helps when you need lower noise or denser routing, but this 125 Hz teaching trace does not require controlled impedance or HDI.
Q2: Why add an ADS1115 instead of using the ESP32 ADC for ECG and the NTC?
A2: The ESP32 SAR ADC is noisy and shares silicon with the radio. A 16-bit I2C converter on AIN0 and AIN1 keeps the millivolt ECG swing and the thermistor divider off Wi-Fi jitter so R-peaks and 35–37 °C skin readings stay believable.
Q3: HASL or ENIG for a first ESP32 sensor prototype with female headers?
A3: Lead-free HASL is the right first-article finish for through-hole headers and 1 oz 2-layer FR-4. Choose ENIG when you move to fine-pitch SMT, repeated probe mating, or boards that will see many insertion cycles.
Q4: How close can copper and pads sit to the outline on 2-layer FR-4?
A4: Keep pads at least 0.2 mm from a routed edge and about 0.4 mm from a V-cut. Perimeter connectors are safer at 0.3–0.5 mm. Copper on the router path becomes exposed metal after fab and is a ground the ECG firmware should not trust.
Q5: Which DFM holds stop 2-layer health-monitor boards in CAM?
A5: Via tenting that disagrees with the mask layer, reference designators on solderable pads, 4 mil pad-to-pad gaps that crack the mask bridge, large PTH headers with no mask opening, undeclared PTH versus NPTH, and duplicated V-cut lines. Align those items before release so the first article solders.
Hi everyone, it's me Ha from How to Electronics. Today I'm going to show you how I designed an ESP32-based patient health monitor with the professional live web dashboard.
Take a look at this dashboard. It looks very professional and similar to what you see on a hospital medical monitor. It shows the heart rate in BPM, then blood oxygen concentration in percentage, also known as SpO2. Here is the patient's body temperature and these are the room temperature and humidity. See this graph? This is the ECG graph or electrocardiogram signal from the patient's body.
I use the AD8232 ECG sensor for ECG. Similarly, the MAX30102 pulse oximeter for SpO2 measurement. A simple 10K NTC thermistor for body temperature measurement. And the BME280 sensor for room temperature and humidity measurement. All these sensors communicate with the ESP32. The hardware is assembled on a professional PCB which I will describe later on.
The ESP32 connects to a Wi-Fi network and hosts a beautifully designed local web dashboard. The dashboard has multiple sections such as vitals monitor, patient record, data logging, and clinical alerts. The main vitals monitor page shows live patient telemetry. From patient record, you can enter or modify patient information. From data logging, you can record real-time data in an Excel sheet and later export it as an Excel file. The project is going to be interesting. So, let's get started.
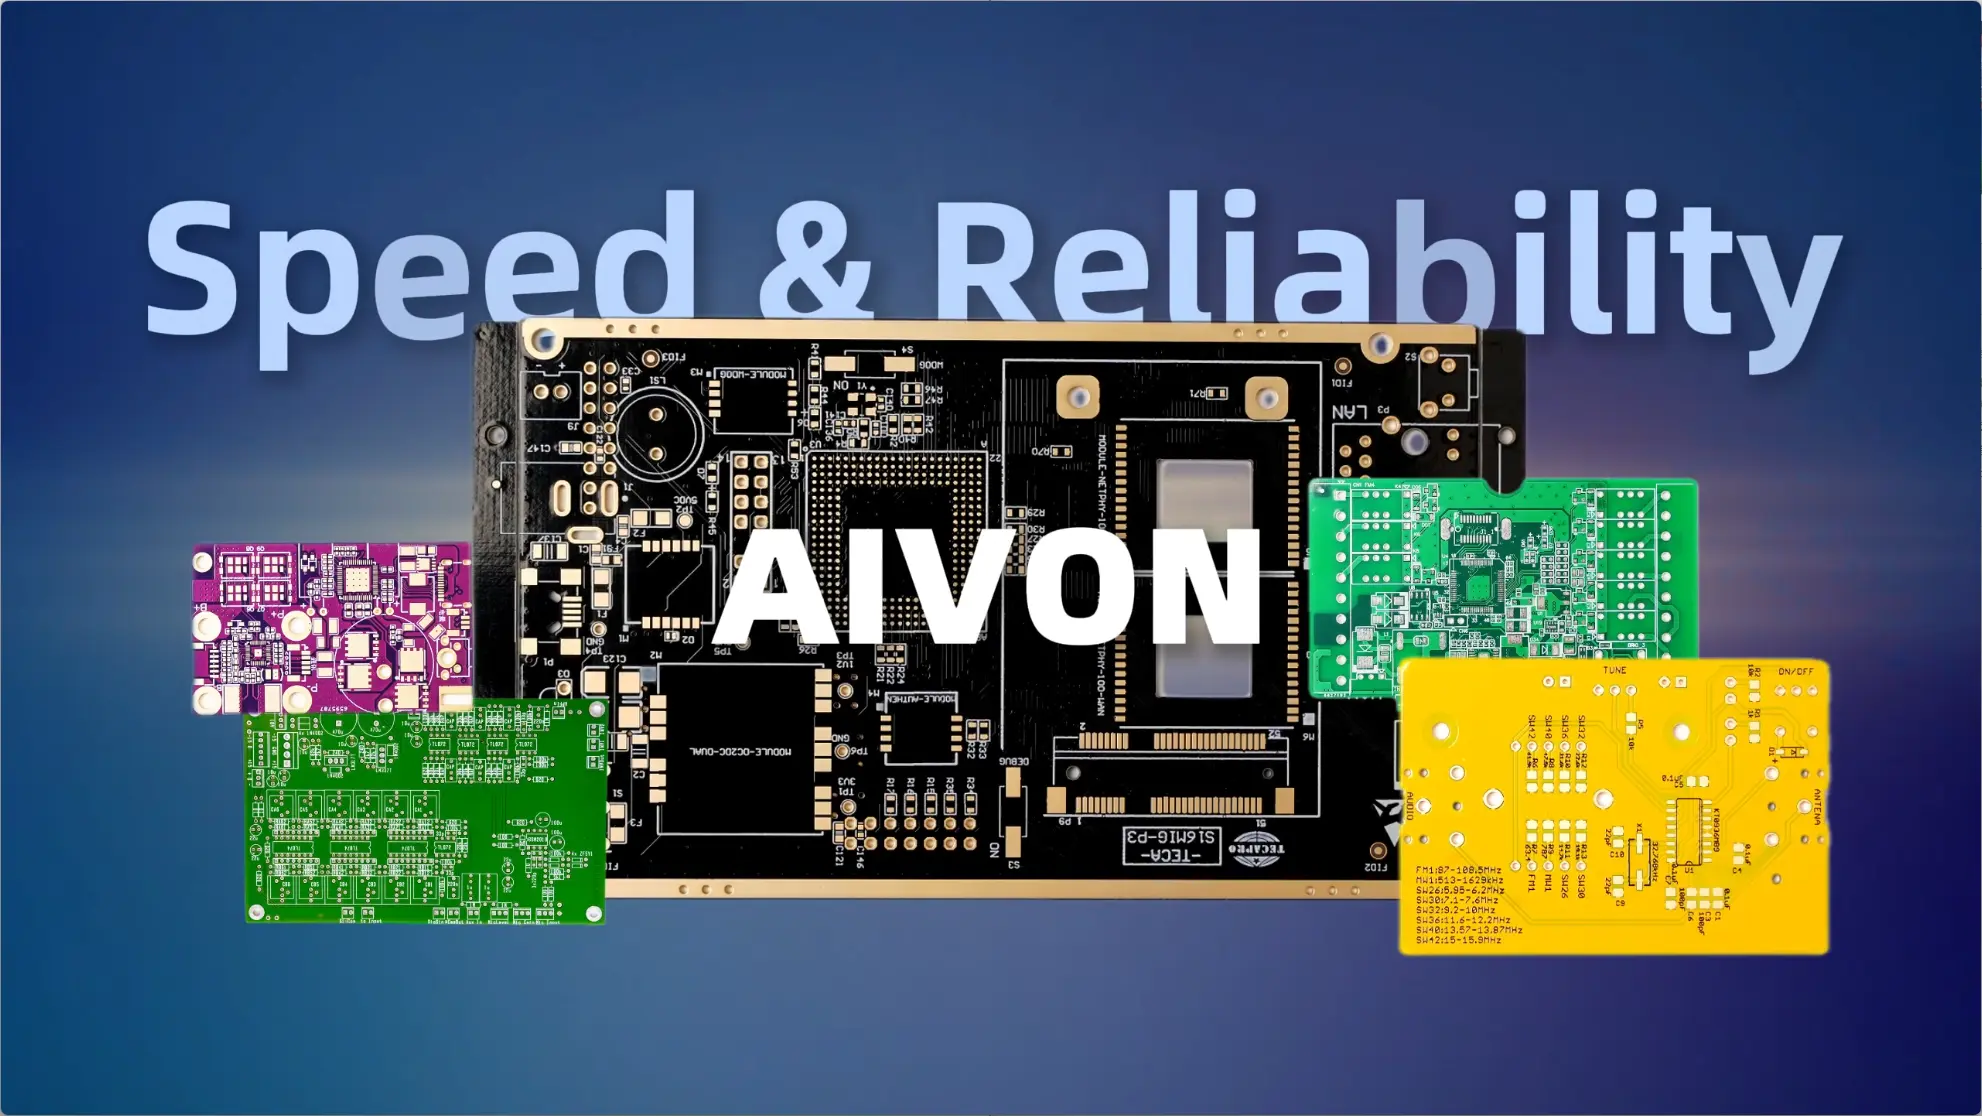
The PCB used in this project is sponsored by Aivon, a global leader in PCB manufacturing and assembly. Aivon provides high quality PCBs with fast production and delivery times. For new users, there is currently a special campaign that includes free shipping and generous discounts, making PCB prototyping far more affordable. You can get a PCB for $1 and PCBA service for as low as $35 with free shipping.
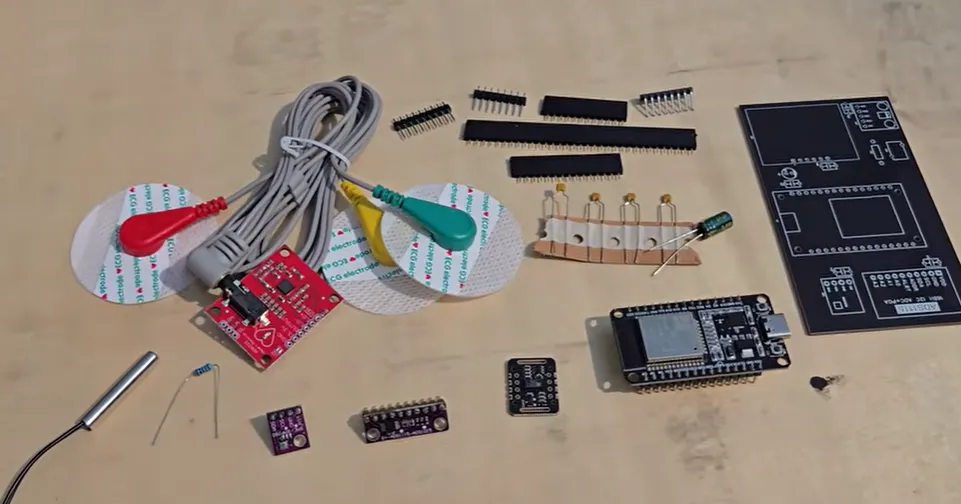
Welcome back again. Let's take a look at the components required to build this project. First, we need an ESP32 microcontroller board. Then, an AD8232 ECG sensor module with ECG electrodes. A MAX30102 pulse oximeter sensor for SpO2 measurement. A BME280 sensor for room temperature and humidity. An ADS1115 16-bit ADC module to read the analog signals. A 10K NTC thermistor for body temperature. And some capacitors of 10 microfarads and 100 nanofarads for power supply decoupling. You can buy all of these components easily from anywhere.
Let's take a look at the block diagram of this project. On the left side of this diagram, you can see all the sensors used for detecting or reading patient data. The ECG sensor and thermistor are read through the ADS1115 ADC. The ESP32 reads all sensor data, calculates BPM from ECG peaks, hosts REST APIs, and serves the live dashboard through the built-in web server. Any phone, tablet, or PC on the same Wi-Fi network can open the ESP32 IP address to view real-time vitals and the ECG waveform.
Here's the circuit diagram for this project. The ESP32 is the main controller of the system. All I2C sensors share the bus on GPIO 21 and GPIO 22. The AD8232 ECG output connects to ADS1115 AIN0. The NTC thermistor divider connects to ADS1115 AIN1. The AD8232 SDN, LO plus, and LO minus pins connect to ESP32 digital pins. Capacitors are added near the power supply lines of each module to improve stability and reduce noise, especially for the ECG signal.
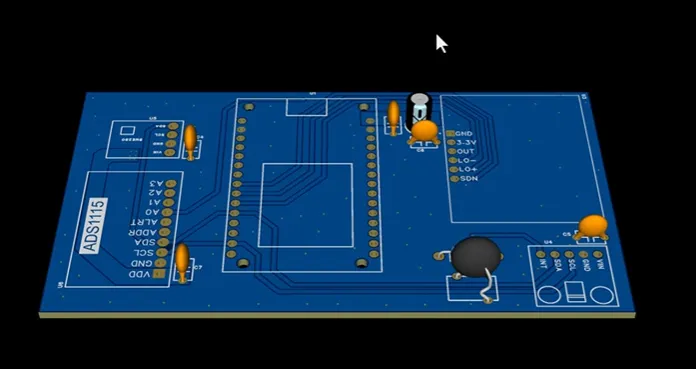
After designing the schematic in EasyEDA, I converted it into a compact PCB layout. All the components are placed on the front side for easier assembly. The routing is done based on signal requirements and component placement. Here is the 2D view of the board from the front side and also from the back side. Similarly, here is a 3D view of the board. The 3D view looks awesome.
So, the next step is to order the PCB. The Gerber files were generated and uploaded to Aivon. Uploading the Gerber file is simple. Just select the board parameters like material, thickness, solder mask, color, and quantity. And here you can see the total quote of just $1. And shipping is also free. If you want to order a PCB for just $1, click the first link in the description.
I placed the order and within a few days, I received these high quality PCBs. The finish, silk screen, and through-hole plating were excellent.
Next, I soldered all of the components for about 15 minutes. I am using female headers for the sensors and MCU so I can remove or replace modules easily. The NTC temperature probe is long, so I made it shorter and soldered it directly onto the board. For the MAX30102, I used wires to connect it as it needs to be placed on the patient's finger. Next, I installed all the components on the headers. The assembly was smooth and the board looks professional once completed.
To test the entire board, I plugged in a USB cable and the ESP32 powered on, showing that everything is good.
Now let's move on to the coding part. We will develop C++ code to read all health sensors with the ESP32 and visualize live vitals and the ECG waveform on a web page. The code starts by including the required libraries for the project. First add the ADS1115, BME280, and MAX30102 sensor libraries. In the Wi-Fi section, the SSID and password are added so the ESP32 can connect to the local network.
The main loop continuously samples ECG at about 125 hertz, processes SpO2 buffers, and reads BME280 and NTC data every 2 seconds. All vitals are sent as JSON through the API/Vitals endpoint.
Here is the header file for the project. The dashboard_page.h file contains all the HTML, CSS and JavaScript code used to create the live web dashboard.
Once the hardware assembly is complete, it's time to upload the code. To upload the code, connect the USB cable directly to the ESP32. In the Arduino IDE, go to tools, board, and select ESP32 dev module. Then, choose the correct COM port. Finally, click the upload button. The code will be uploaded to the ESP32 board.
Now, let's connect the sensors to the patient's body. For the ECG signal, you need to connect these three ECG electrodes. Just remove the plastic cover and place them on your body. I am placing them on my arms just for testing, but in reality, here is how you should connect them to the patient's body. Follow this diagram and the electrode colors. So finally I have placed all of the electrodes.
The next step is connecting the MAX30102 pulse oximeter sensor. Place it lightly on your finger and wrap it with something secure such as Velcro. For the thermistor, add it to any part of the body and secure it with the Velcro as well. So, your patient's body connections are done.
Now, connect the ESP32 to your computer and open the serial monitor at 115200 baud. The ESP32 first connects to the Wi-Fi and then prints the IP address in the serial monitor. This IP address is used to open the live health dashboard in a web browser.
To access the web dashboard, enter the IP address in a web browser on any phone, laptop, or PC connected to the same Wi-Fi network. The vitals monitor page shows live heart rate, SpO2, body temperature, room temperature, humidity, and a scrolling ECG waveform panel. A speaker icon in the top bar can toggle heartbeat monitor sound synced to the live BPM.
From the left side menu, we can open vitals monitor, patient record, data logging, and alerts. On the vitals monitor page, the ECG panel shows a live scrolling trace with PQRST style cardiac complexes where leads are connected. The heart rate card updates BPM calculated from the ECG signal from the MAX30102 sensor. The SpO2 card updates with the percentage value and shows normal or low status. Body temperature is read from the NTC thermistor probe when in contact with skin. Room temperature and humidity are placed from the BME280 sensor for environmental logging.
Open the patient record page to enter patient details such as name, patient ID, bed number, ward, age, blood group, gender, contact number, and clinical notes. This information is saved in the browser and showed on the dashboard status bar.
The data logging page allows us to record vitals at selectable intervals such as 2, 3, 5, 10, 15, 30, or 60 seconds. We can start logging, stop logging, clear data, and export everything as an Excel file with patient details at the top of the sheet.
The alerts page monitors cardiac rhythm, SpO2 level, body temperature, room environment, and Wi-Fi connection status. Each alert shows a status badge and a clinical suggestion tip.
That's all from the video part today. All of the detailed written guides related to this project can be found on the website article of how to electronics. You can find the bill of materials, schematic, PCB, Gerber file, source code program, and other instructions here.
I hope you like this video, so why not drop a like and hit the subscribe button. Finally, thank you so much for watching. See you in the next video.