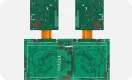



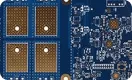


This article documents five real SMT BGA failure-analysis cases using the dye stain method. Each case summarizes the test objective, the inspection approach (component-side versus PCB pad-side fracture planes), the dye stain findings, and the engineering conclusions and corrective actions where applicable. The dye stain technique is used to expose cracks, weak interfaces, and voids: dye infiltrates along open interfaces and defects, and after fracturing the assembly along the solder interconnect plane, the stained areas reveal the failure location and mode.
Case 1: Destructive Validation of BGA Solder Quality
Product: M71IX MB
Objective: Engineering requested destructive analysis of the ATI BGA chip U33 to assess whether any abnormality occurred during the soldering process.
S/N: 11S13M8297ZJ1YK95BP1V6
The dye stain method was applied. Cross-sections were evaluated on both the component side and PCB pad side. The soldering was normal; no solder cracks or voids were found.
BGA Mapper software was also used for classification. The predominant cross-section types fell into the internal categories Type 3, Type 4, and Type 5, accounting for 90.5% of the dataset. No solder cracks were detected, and the overall solder quality for this device was judged acceptable.

Figure 1 | Case 1: Sample overview for U33 dye stain analysis.

Figure 2 | Case 1: Component-side and pad-side fracture-plane comparison showing normal solder joints with no cracks or voids.

Figure 3 | Case 1: BGA Mapper classification summary; no solder cracks observed.
Case 2: Drop-Test Failure With Corner Cracks at BGA
Product: KS-Note (05320-SB)
Background: Customer reported a failure during drop testing. With customer approval, dye stain analysis was conducted on the returned test board.
S/N: 55.4B501.D0G5340004AMOSE
Phenomenon: The product failed functional testing after the drop test.
Initial assessment by hardware (EE) and process (PE) engineering identified devices U51, U55, and U61 as non-functional.
The dye stain method was used to compare component-side and PCB pad-side fracture planes. Anomalies were found and documented for the implicated components.

Figure 4 | Case 2: Overview of the suspect BGAs (U51, U55, U61) following drop-test failure.
Conclusions based on dye stain evidence:
- U51: No abnormal soldering or solder cracks were found.
- U55: Solder cracking occurred at a BGA corner.
- U61: Solder cracking occurred at a BGA corner.
- All observed cracks were Type 4, meaning the fracture was between the PCB pad and the solder ball (dye penetrated the pad-to-ball interface).
Case 3: Functional-Test Failure Linked to Mechanical Stress Near a Screw Standoff
Product: Yuhina 3 MB
Phenomenon: U27 failed functional testing.
Inspection location: U27
S/N: 55.40I01.01142100864KD1H
Dye stain analysis identified solder cracking at corner 2 of the BGA. The failure mode included Type 4 (dye penetration at the PCB pad-to-solder-ball interface) and Type 5 (dye penetration into the pad base material).

Figure 5 | Case 3: Overview of the U27 BGA under investigation.
Analysis conclusion: Corner 2 of U27 exhibited solder cracking consistent with Type 4 and Type 5 signatures.
Root cause: A screw standoff is located near corner 2 of U27. Excessive mechanical stress during assembly is likely to have induced the corner solder crack.
Corrective action: Coordinate with mechanical engineering to improve the screw-fastening jig and confirm the torque settings of the electric screwdriver.
Case 4: Solderability Verification and Voiding Reduction by Reflow Profile Optimization
Product: M71IXA MB
Inspection locations: U7, U18, U25, U16
Objective: Verify BGA solderability for the PR product.
Production date of the verified lot: 10/16

Figure 6 | Case 4: Overview of the BGAs selected for solderability verification (U7, U18, U25, U16).
Dye stain analysis compared component-side and pad-side fracture planes across the selected devices. Severe internal voiding was observed in the initial runs.
Analysis conclusion and corrective actions:
- U7, U18, U25, and U16 exhibited severe voiding.
- The lot was processed on a 5-zone reflow oven. To address the voiding, the reflow thermal profile was adjusted:
- Optimize the soak time and time-above-liquidus (reflow time).
- Move to a 7-zone reflow oven to better implement the optimized profile.
Improvement result: After optimization, dye stain analysis confirmed the internal void ratio inside the BGA joints was effectively controlled below 25%.
Improvement summary:
- Adjusting the SMT thermal profile effectively reduced internal BGA voiding.
- Key profile changes:
- Extend soak time.
- Shorten time above liquidus.
- Across the verified BGAs, internal void percentage was controlled to below 25%.
Case 5: Avoiding Misinterpretation During Dye Stain Analysis
Topic: Preventing false positives during dye stain evaluation.
- Before analysis, use clean compressed air to thoroughly remove debris from the sample surface.
- When an anomaly is observed, inspect the corresponding mirror surface on the mating fracture plane to confirm the presence of matching dye marks. This helps distinguish true dye penetration along a defect from residual contamination or surface staining

Figure 7 | Case 5: Example highlighting the need to verify mirrored fracture surfaces to avoid false-positive interpretations.
Notes on Interpreting Dye Stain "Types"
This set of cases references Type 3, Type 4, and Type 5 observations based on internal classification. Within these cases:
- Type 4 indicates dye penetration between the PCB pad and the solder ball, consistent with a weak pad-to-ball interface or a crack at that interface.
- Type 5 indicates dye penetration into the pad base material, consistent with damage extending into or under the pad metallization.
In drop and assembly-mechanical stress scenarios, cracks tend to initiate at high-strain regions such as BGA corners. In thermal-process scenarios, voiding within the solder bulk is influenced by flux activation, outgassing, and the time–temperature profile. The combined component-side and pad-side fracture-plane comparison is essential to localize the failure interface and avoid misdiagnosis.
Across the five cases, dye stain analysis provided clear localization of failure modes—no-crack confirmation in Case 1, corner cracks in Case 2, mechanically induced cracks near a screw standoff in Case 3, process-induced voiding and its mitigation in Case 4, and best practices to avoid misreads in Case 5. These examples illustrate how dye stain complements electrical test results, X-ray, and cross-sectioning to close the loop between failure symptoms, physical evidence, and actionable process or mechanical controls.